The Consolidating Stack

Klipfolio Research — August 2026
Three years of anonymized data-connection activity across small and mid-sized businesses reveal a steady shift in how they build their data stacks. Marketing point-tools are losing ground. Infrastructure is winning.
Every time a small business connects Salesforce, Google Analytics, or a SQL Server database to build a dashboard, it leaves a small, anonymous trace: which service, what size company, where in the world. Multiplied across tens of thousands of SMB accounts over three years, that trace becomes a rough but genuine map of how small business data stacks are evolving — a map almost nobody else has, because almost nobody else sits underneath this many companies' data pipelines at once.
This report is built entirely from that first-party connector data. Three findings stood out enough to warrant a closer look: a broad consolidation toward infrastructure and away from marketing point-tools; a clean handoff from lightweight finance tools to CRM as companies grow past the smallest size band; and a persistent, three-year-stable gap in CRM adoption between West European and North American SMBs that external research helps (partially) explain.
Methodology, in brief: All figures below are percentage shares of total connector activity, not absolute connection counts. Data covers accounts below 1,000 employees only, compared across the same two-month window (Jul–Aug) in each of three consecutive years to control for seasonality. In total, this analysis draws on over 34,000 individual data-source connections across the three snapshot periods combined.
A small number of regions — Central & East Asia, Central & South Africa, and the Middle East & North Africa — were excluded from the regional comparison in Section 3 because their sample sizes were too thin to report reliably. All other cuts in this report meet our minimum sample threshold. Full caveats are in the Notes & Cautions section at the end; please read them before quoting figures externally.
1. A consolidating stack
Looking at each category's share of total connector activity across the three-year window, the mix is moving in a clear direction — some categories are steadily gaining ground, others are steadily losing it.
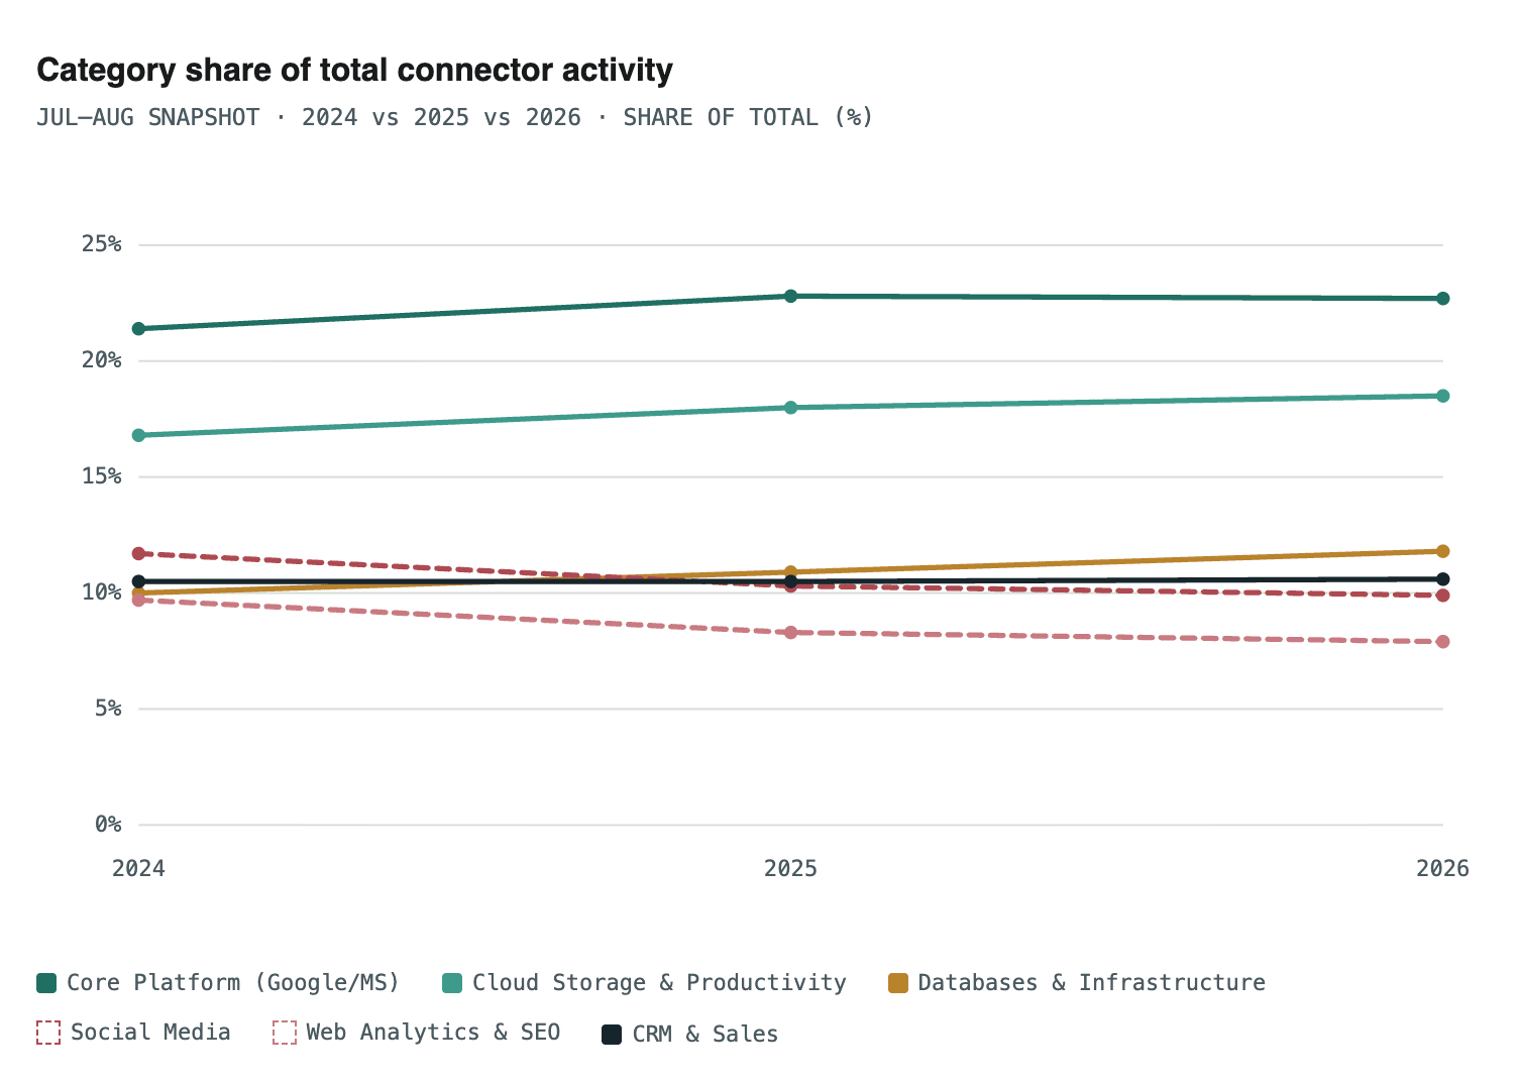
Top 6 categories by 2026 share shown. Full category table below.
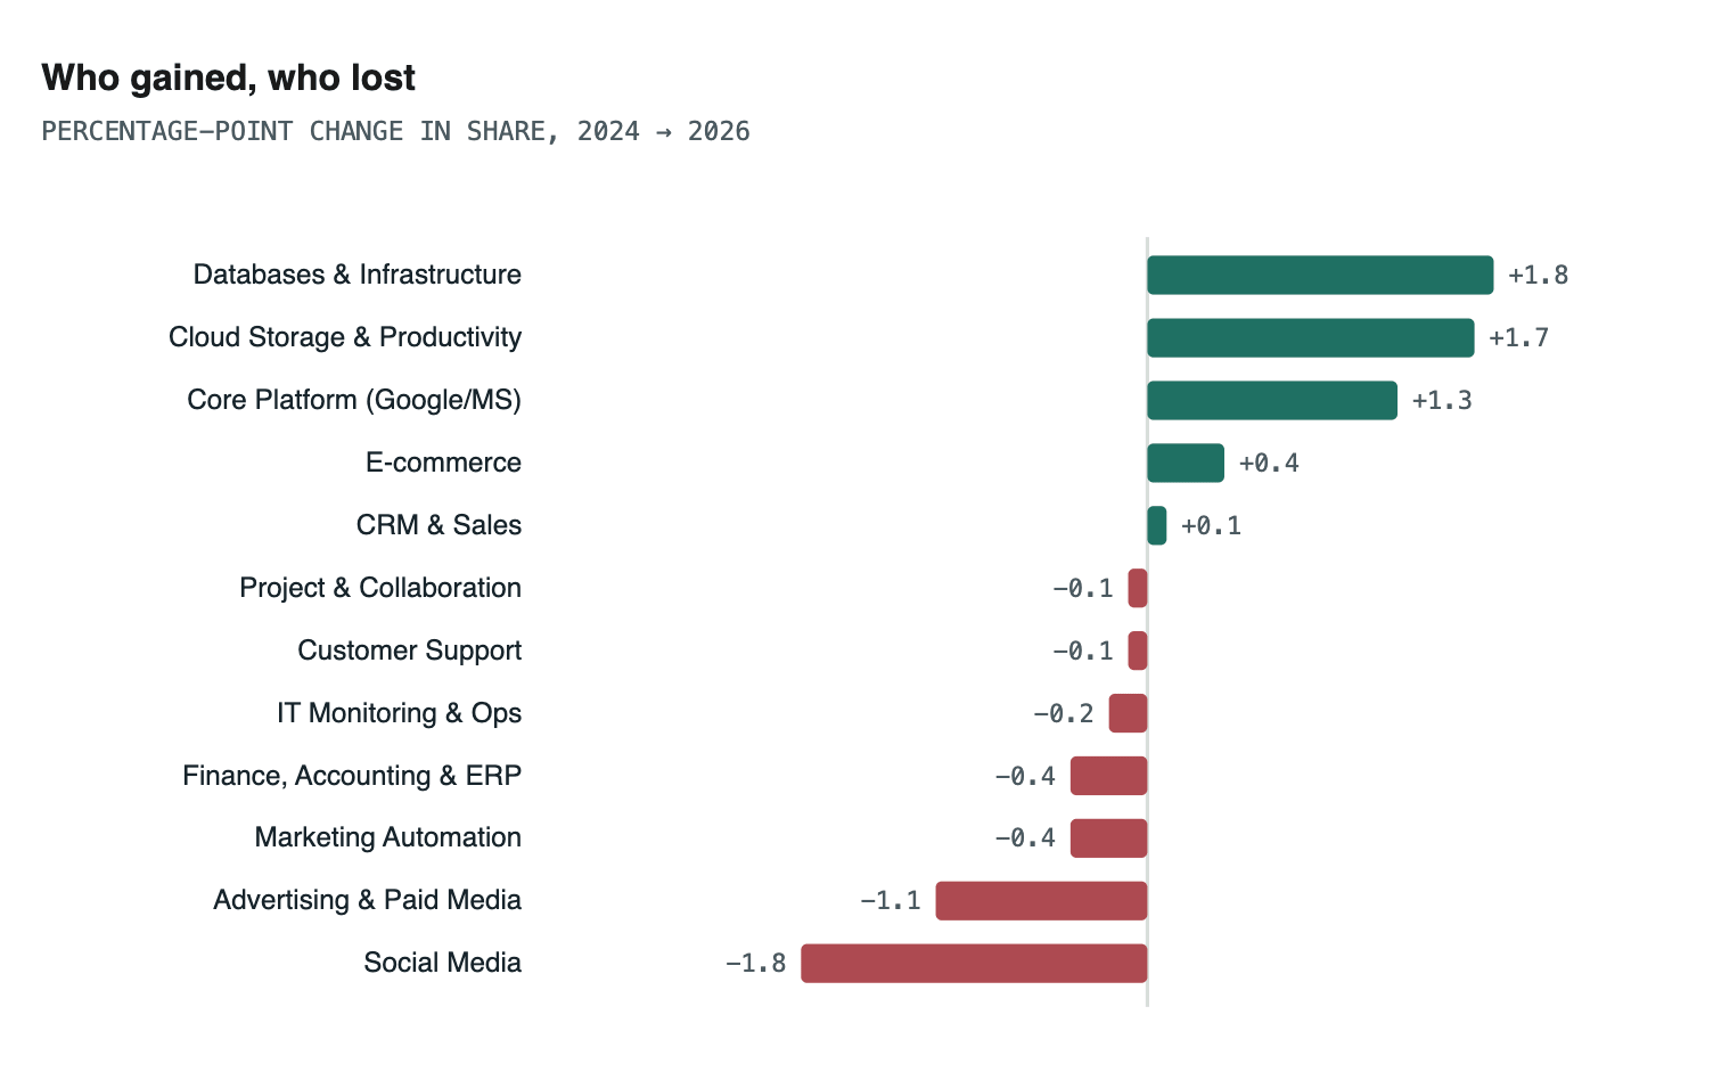
Note: Web Analytics & SEO declined 1.8 points, tied with Social Media for the largest decline.
| Category | 2024 | 2025 | 2026 | Change |
|---|---|---|---|---|
| Core Platform (Google / Microsoft) | 21.4% | 22.8% | 22.7% | +1.3 pts |
| Cloud Storage & Productivity | 16.8% | 18.0% | 18.5% | +1.7 pts |
| Databases & Data Infrastructure | 10.0% | 10.9% | 11.8% | +1.8 pts |
| CRM & Sales | 10.5% | 10.5% | 10.6% | +0.1 pts |
| E-commerce | 1.7% | 1.9% | 2.1% | +0.4 pts |
| Social Media | 11.7% | 10.3% | 9.9% | -1.8 pts |
| Web Analytics & SEO | 9.7% | 8.3% | 7.9% | -1.8 pts |
| Advertising & Paid Media | 6.4% | 5.7% | 5.3% | -1.1 pts |
| Finance, Accounting & ERP | 4.1% | 3.8% | 3.7% | -0.4 pts |
| Project & Team Collaboration | 2.1% | 2.0% | 2.0% | -0.1 pts |
| Customer Support | 2.0% | 1.9% | 1.8% | -0.1 pts |
| IT Monitoring & Ops | 1.3% | 1.1% | 1.1% | -0.2 pts |
| Marketing Automation & Engagement | 0.9% | 0.7% | 0.6% | -0.4 pts |
Read at the category level, this isn't "marketing is dying" — CRM & Sales is flat, and e-commerce is steadily growing. It's more specific: Social Media and Web Analytics/SEO connections are the biggest decliners, each losing 1.8 points of share, while databases, cloud storage, and core platform connectors are the clear gainers. That reads like SMBs consolidating around fewer, more durable systems of record, and pulling back on lighter, campaign-driven marketing integrations.
The individual movers
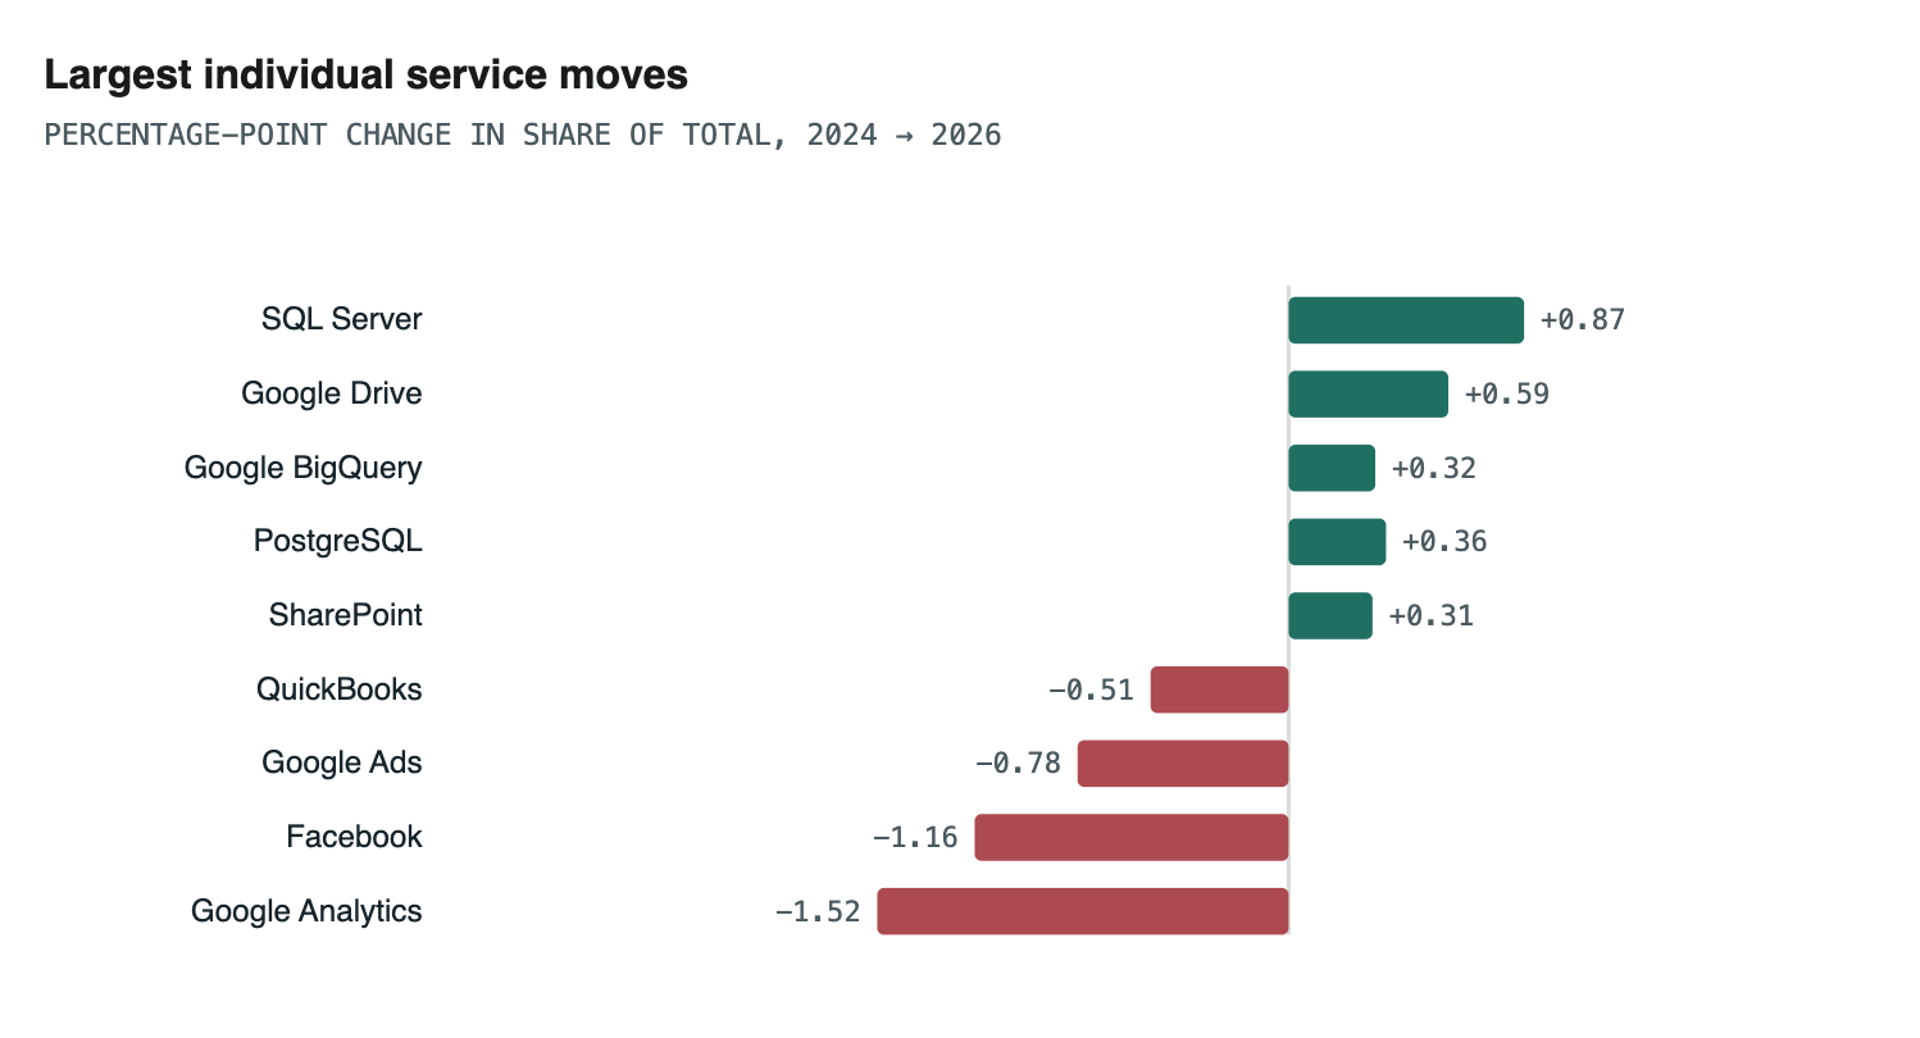
SQL Server is the single biggest infrastructure gainer; Google Analytics is the single biggest decliner of any individual service — a bigger drop than Facebook or Google Ads. That's worth flagging on its own, and plausibly connects to the Google Analytics migration disruption that rippled through the analytics industry starting in 2023–2024, though our data can only show the pattern, not confirm the cause. (Note: a separate "Facebook Ads" connector was retired after 2024 and folded into the general Facebook connector, so Facebook's figure from 2025 onward reflects both.)
Our take: We'd resist the temptation to read this purely as "SMBs are abandoning marketing." A more precise read: the tools that require ongoing campaign management and manual upkeep (ad platforms, social analytics) are losing share to tools that run largely unattended once configured (databases, cloud drives, core platform connectors). That's consistent with resource-constrained small businesses gravitating toward set-it-and-forget-it data infrastructure over actively-managed marketing tooling — but it's an interpretation, not a measured fact.
2. Company size: the finance-to-CRM handoff
Splitting the current period by company size band reveals a cleaner story than the time trend: as SMBs grow, they trade lightweight finance tools for CRM.
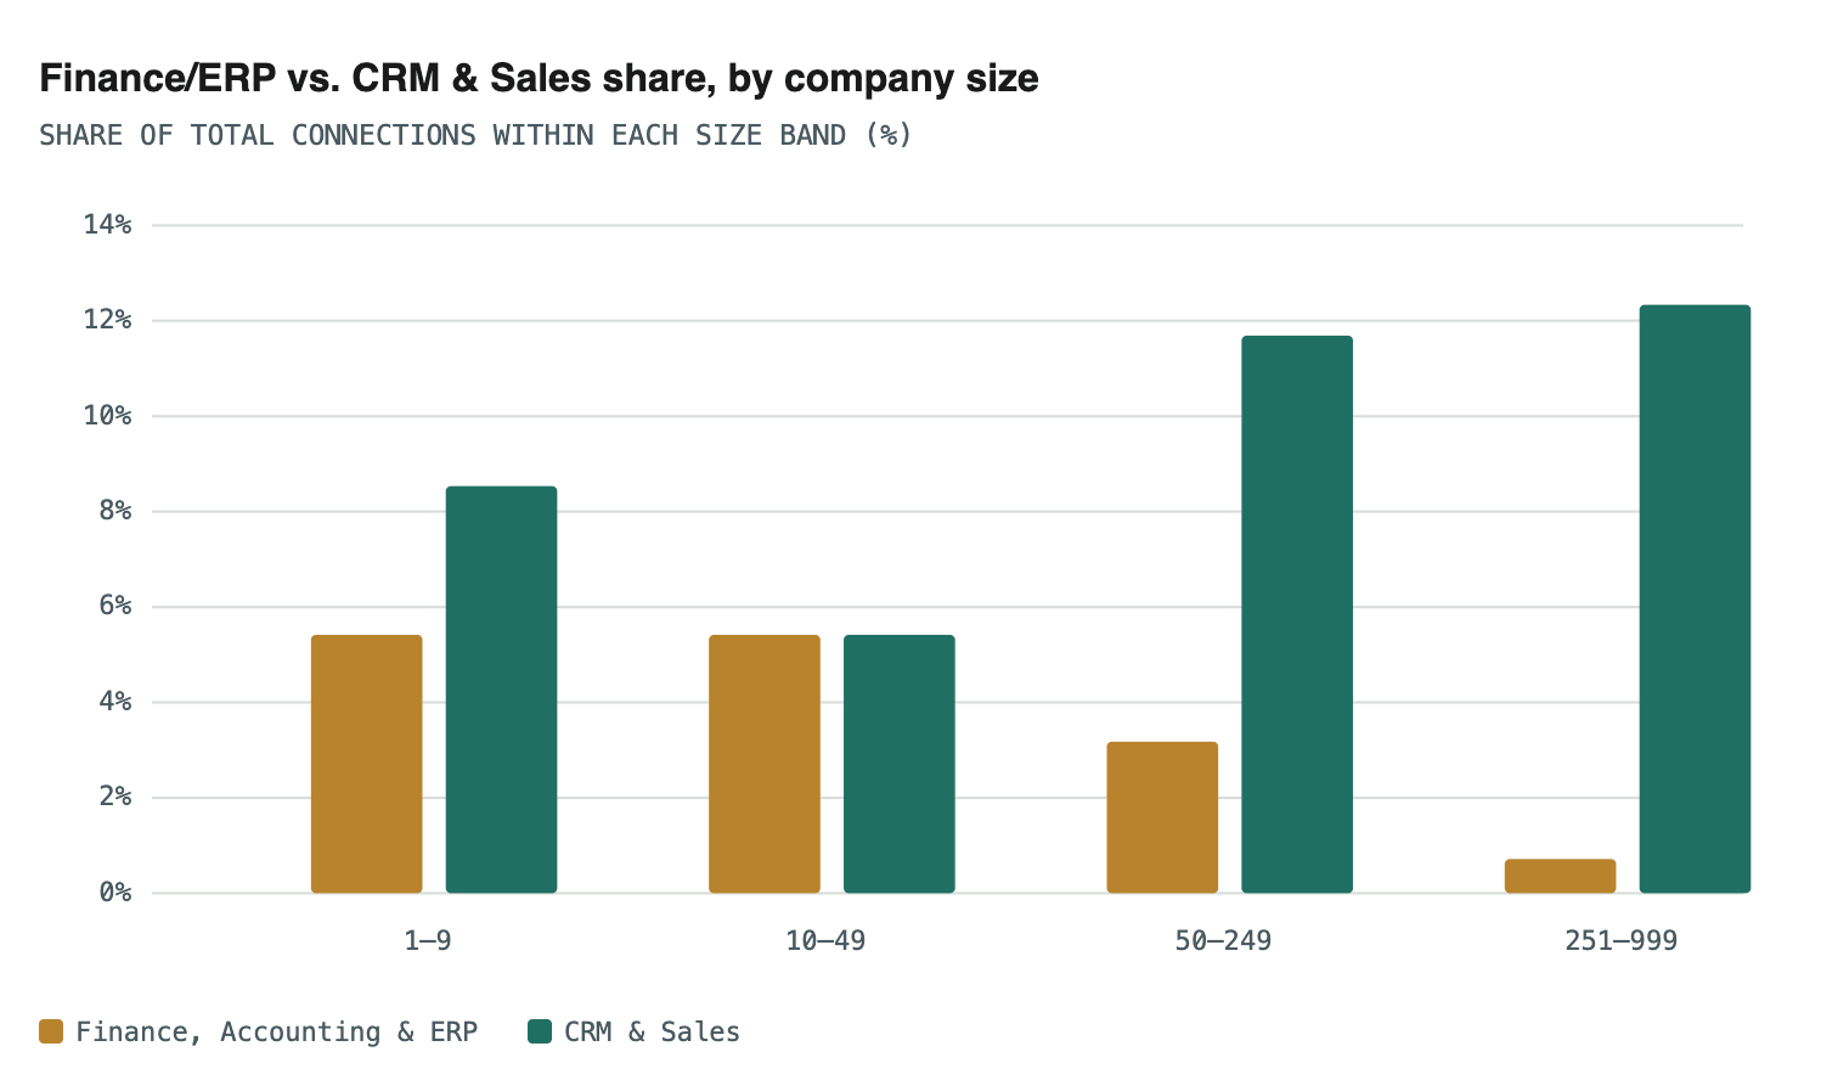
Finance, Accounting & ERP tools (QuickBooks, Xero-type connectors) run at 4.8% of connections for the smallest companies and fall steadily to just 0.8% at 251–999 employees — a 4-point drop. CRM & Sales moves the opposite direction: 8.9% at the smallest size, climbing to 12.4% at the largest SMB band. Advertising follows finance downward (6.4% -> 5.1%), while Core Platform connectors hold roughly flat across every size band (22–24%), acting as the stable floor underneath all of it.
Reading this: This tracks a familiar operational maturity curve, not a surprising one: solo operators and micro-businesses run their books through simple accounting software and market themselves directly, while a company crossing into the 50+ employee range typically has a first dedicated salesperson or ops hire who wants a real CRM. The connector data confirms the pattern with real usage evidence rather than survey self-report, which is the more interesting part.
3. The West Europe CRM gap
The most durable finding in this dataset is regional, not temporal. Comparing North America, West Europe, and Australia & New Zealand (the three regions with adequate sample size — see caveats), West European SMBs run a CRM connection share roughly half that of the other two regions, and it hasn't moved in three years.
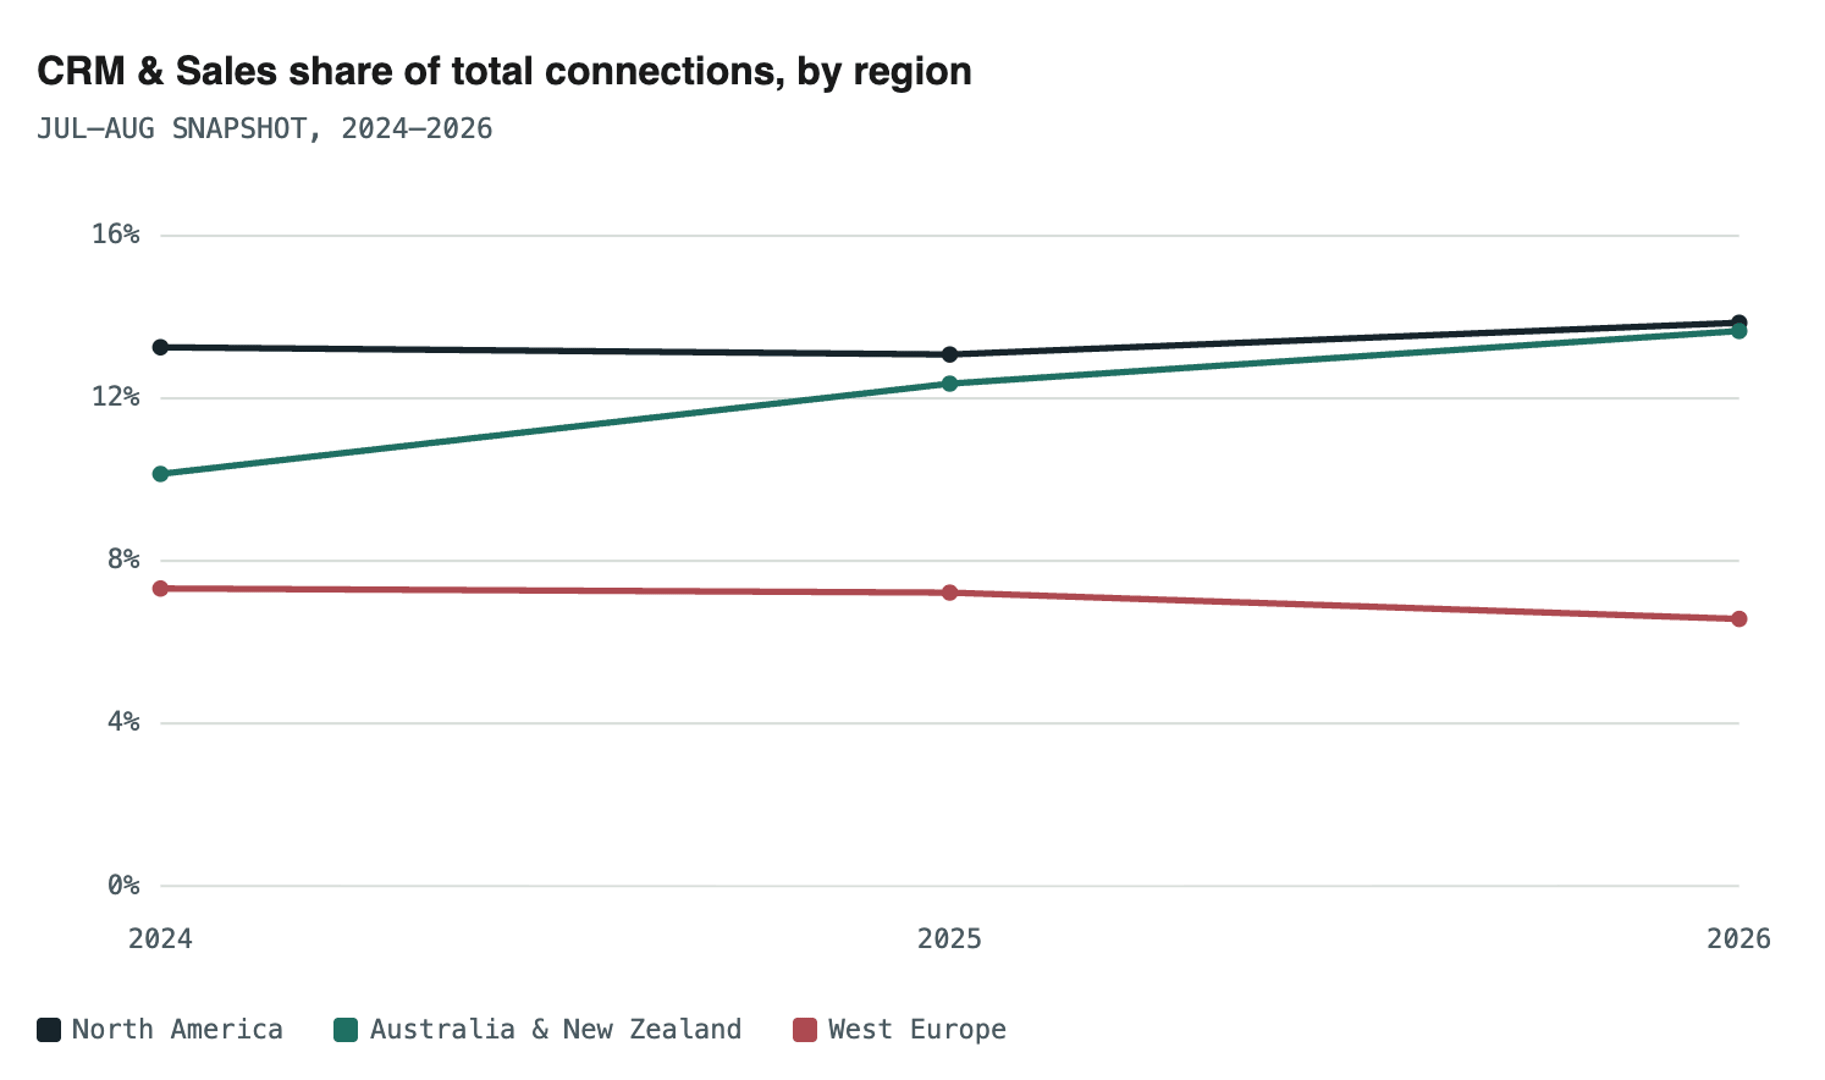
North America and ANZ track closely and have, if anything, converged over the period. West Europe has held flat at 6.6–7.3% every single year — never closing the gap, but also not widening it. The same regional pattern shows up, inverted, in Finance/ERP (West Europe runs roughly a fifth of North America's share, also stable across all three years) and in the opposite direction for Web Analytics/SEO and Advertising, where West Europe consistently runs higher than North America.
| Category | Region | 2024 | 2025 | 2026 |
|---|---|---|---|---|
| Finance, Accounting & ERP | North America | 6.2% | 5.8% | 5.5% |
| West Europe | 1.3% | 1.2% | 1.3% | |
| ANZ | 5.6% | 5.3% | 6.1% | |
| Web Analytics & SEO | North America | 9.2% | 7.5% | 6.6% |
| West Europe | 11.2% | 10.2% | 10.1% | |
| ANZ | 8.6% | 6.6% | 6.6% |
Why might this be happening?
We looked for outside evidence rather than guessing. A few data points are worth weighing together:
Independent market sizing puts North America at roughly 42% of global small-business CRM software market share versus 31% for Europe — a very similar proportional gap to what we see in our own connector data, which is a useful sanity check that our SMB sample isn't an outlier.
Macro research on GDPR's economic effects found the regulation raised the effective cost of handling data by roughly 20%, and associates it with European firms pulling back on data collection and analytics investment generally — a plausible mechanism, since CRM is fundamentally a system for centralizing customer personal data. This connects to broader questions of data governance and compliance that shape how European SMBs approach customer data centralization.
Industry guidance aimed at European CRM buyers repeatedly cites practical, non-regulatory friction too: multi-language and multi-currency operations, and sales workflows that don't transfer cleanly across markets the way they do across US states.
Broader OECD research on SME technology adoption found the small-firm-vs-large-firm adoption gap is largest specifically in CRM and e-commerce among all technology categories studied — suggesting CRM may just be an inherently harder category for smaller companies everywhere, which would compound with any Europe-specific friction rather than being purely a Europe story.
Caution — correlation, not proof: None of this confirms causation. Our connector data can't distinguish between "European SMBs are choosing not to centralize customer data due to compliance friction," "they're using CRM tools we don't have connectors for" (SAP and other EU-based vendors were specifically flagged in our research as regionally preferred), or "European SMBs in our sample skew toward company profiles that need less CRM." We're comfortable publishing this as a well-supported hypothesis, not as a settled explanation. Any external-facing version of this finding should be framed as "a persistent pattern with plausible explanations" rather than "GDPR causes lower CRM adoption."
Notes & cautions for interpreting this data
Data window is 2.5 years, not 3. The underlying metric has reliable data only from July 2024 onward; "2024" throughout this report refers to a two-month Jul–Aug snapshot, not a full year.
Taxonomy changed mid-window. Several connector names shifted in early 2025 (e.g., "mongo db" -> "mongodb", a standalone "Facebook Ads" connector disappearing). We normalized clear spelling/versioning variants but kept genuinely distinct services separate.
Industry-level cuts are not yet available. The metrics carrying an industry dimension are currently affected by a data pipeline issue (duplicate-key error on every query shape tested) and could not be included. This is likely our strongest remaining content angle once resolved.
Regional figures exclude thin-sample regions. Central & East Asia, Central & South Africa, and the Middle East & North Africa had sample sizes too small to report reliably and were excluded from regional comparisons.
"SMB" here means under 1,000 employees and excludes the 1,000+ enterprise band by design, per this report's scope.
This is Klipfolio's own customer base, not a random sample of all SMBs globally — it's a real, large, first-party dataset, but it's shaped by who chooses Klipfolio, which likely skews toward companies that already value data/dashboarding.
What this might mean going forward
If the consolidation pattern holds, the next 12–18 months likely bring less sprawl, not more: SMBs seem to be settling around a smaller, sturdier set of systems — a core database, a cloud drive, a CRM if they've earned one — rather than accumulating point tools for every marketing channel. That has a direct implication for a company like Klipfolio: the connectors worth investing in going forward look less like new ad-platform integrations and more like deeper, more reliable coverage of databases and core productivity platforms. Teams that want to visualize these consolidated stacks will find custom dashboards and reports increasingly useful as the number of source systems stabilizes.
The West Europe CRM gap is the one to watch rather than assume. The EU's ongoing "Digital Omnibus" GDPR simplification effort — actively being negotiated through 2026 — is explicitly aimed at reducing compliance burden for smaller companies. If compliance friction really is suppressing European CRM adoption, that gap should start narrowing over the next few years as reforms land. If it doesn't narrow, that's a signal the real driver is something more structural (language/currency fragmentation, sales culture, vendor preference for EU-based platforms) rather than regulatory. Either way, it's a clean natural experiment worth re-checking against this same dataset in a year.
Source: Klipfolio, SMB accounts under 1,000 employees. External sources: Wave Connect CRM Statistics 2026; Business Research Insights, Small Business CRM Software Market; SuperOffice, "Best CRM for European Businesses"; Luvian Global Insights on EU regulatory burden; OECD/Transatlantic SME digitalization research. Prepared for internal review — figures are share-of-total percentages; verify before external publication.
Data and tables
Category share of total connector activity
JUL–AUG SNAPSHOT · 2024 vs 2025 vs 2026 · SHARE OF TOTAL (%)
| Category | 2024 | 2025 | 2026 |
|---|---|---|---|
| Core Platform (Google/MS) | 21.4% | 22.8% | 22.7% |
| Cloud Storage & Productivity | 16.8% | 18.0% | 18.5% |
| Databases & Infrastructure | 10.0% | 10.9% | 11.8% |
| CRM & Sales | 10.5% | 10.5% | 10.6% |
| Social Media | 11.7% | 10.3% | 9.9% |
| Web Analytics & SEO | 9.7% | 8.3% | 7.9% |
Top 6 categories by 2026 share shown.
Who gained, who lost
PERCENTAGE-POINT CHANGE IN SHARE, 2024 -> 2026
| Category | Change |
|---|---|
| Databases & Infrastructure | +1.8 pts |
| Cloud Storage & Productivity | +1.7 pts |
| Core Platform (Google/MS) | +1.3 pts |
| E-commerce | +0.4 pts |
| CRM & Sales | +0.1 pts |
| Project & Collaboration | -0.1 pts |
| Customer Support | -0.1 pts |
| IT Monitoring & Ops | -0.2 pts |
| Finance, Accounting & ERP | -0.4 pts |
| Marketing Automation | -0.4 pts |
| Advertising & Paid Media | -1.1 pts |
| Social Media | -1.8 pts |
| Web Analytics & SEO | -1.8 pts |
Note: Web Analytics & SEO declined 1.8 points, tied with Social Media for the largest decline.
Largest individual service moves
PERCENTAGE-POINT CHANGE IN SHARE OF TOTAL, 2024 -> 2026
| Service | Change |
|---|---|
| SQL Server | +0.87 pts |
| Google Drive | +0.59 pts |
| PostgreSQL | +0.36 pts |
| Google BigQuery | +0.32 pts |
| SharePoint | +0.31 pts |
| QuickBooks | -0.51 pts |
| Google Ads | -0.78 pts |
| -1.16 pts | |
| Google Analytics | -1.52 pts |
Finance/ERP vs. CRM & Sales share, by company size
SHARE OF TOTAL CONNECTIONS WITHIN EACH SIZE BAND (%)
| Size band | Finance, Accounting & ERP | CRM & Sales |
|---|---|---|
| 1–9 employees | 4.8% | 8.9% |
| 10–49 employees | 3.6% | 10.1% |
| 50–249 employees | 1.9% | 11.4% |
| 251–999 employees | 0.8% | 12.4% |
CRM & Sales share of total connections, by region
JUL–AUG SNAPSHOT, 2024–2026
| Region | 2024 | 2025 | 2026 |
|---|---|---|---|
| North America | 13.1% | 13.4% | 13.8% |
| Australia & New Zealand | 12.6% | 13.0% | 13.2% |
| West Europe | 6.6% | 7.1% | 7.3% |