Call Center Dashboard
Turn your call center data into actionable insights.
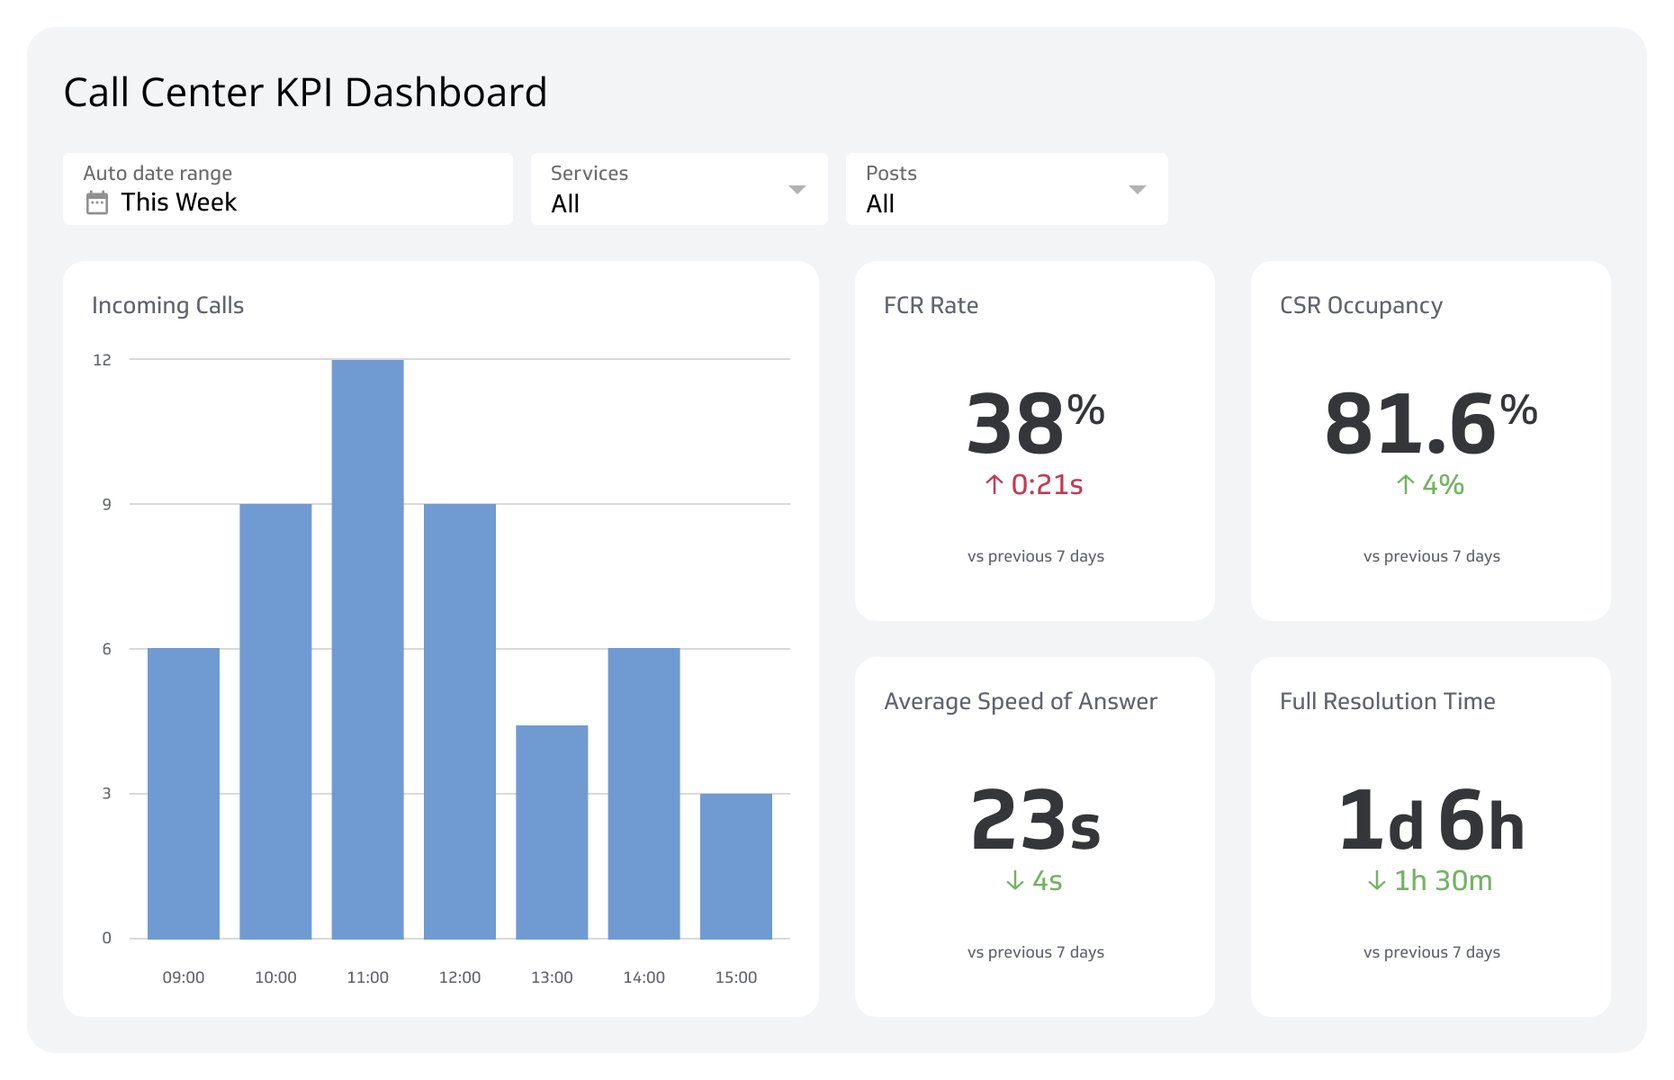
What is a KPI dashboard for call centers?
A call center KPI dashboard is a centralized view of the metrics that matter most to your team's performance, updated in real time so you can act on what you see.
Are you balancing day-to-day call center fires with long-term strategic goals? It's a tough act. A call center dashboard gives you both the tactical awareness for today and the analytical view you need for tomorrow. By monitoring key efficiency metrics in one place, you can empower your team, improve customer satisfaction, and drive operational excellence.
From real-time alerts to long-term trends
A successful call center manager needs to operate on two levels. Tactically, you need real-time data on agent availability and call queues to handle daily volume. Strategically, you need to analyze performance over weeks and months to identify coaching opportunities, optimize staffing, and reduce costs.
This dashboard bridges that gap by tracking long-term trends, helping you move from reactive problem-solving to proactive performance management. It lets you understand your team's strengths and spot opportunities for improvement.
Relevant KPIs and metrics
To get a complete view of your call center's performance, focus on a balanced set of metrics that cover efficiency, quality, and cost:
By tracking these core KPIs, you transform your call center from a cost centre into a value-driver for your business.
Why call center dashboards matter
Call center teams handle a high volume of interactions daily. Without a dashboard, performance data stays buried in spreadsheets, shift reports, and disconnected tools. A well-built KPI dashboard surfaces the right information at the right time, so managers can coach agents, adjust staffing, and respond to service issues before they escalate.
The most effective dashboards do three things:
Centralize data from your phone system, CRM, and ticketing tools into one view
Highlight trends across daily, weekly, and monthly timeframes
Trigger action by making it obvious when a metric falls outside an acceptable range
When your team can see the same data in real time, decisions happen faster and with more confidence.
Key call center dashboard types
Different roles and goals call for different dashboards. Here are the most common types call center managers rely on.
Customer Satisfaction Dashboard
Customer satisfaction dashboards visualize feedback from customers about their service experiences. Metrics they track include net promoter scores, customer satisfaction scores, customer effort scores, and first-call resolution rates.
These dashboards help you identify patterns in customer feedback, such as recurring issues, common compliments, and areas needing improvement. Their data also supports resource allocation decisions based on feedback trends.
| Who it's for | Call center managers, quality assurance teams, customer service representatives, team leaders, supervisors, training coordinators, business analysts, technical support teams, senior management, and reporting analysts |
| How often it's needed | Real-time, daily, weekly, monthly |
| Covered KPIs | Net promoter score (NPS), customer feedback trends, overall satisfaction ratings, first call resolution (FCR) rate, call resolution time, customer effort score, agent satisfaction ratings, customer retention rate, call escalation rate, repeat call rate, time to resolve complaints, service level adherence, call monitoring and quality scores, customer sentiment analysis, response time to feedback, percentage of positive/neutral/negative feedback, customer churn rate, resolution accuracy score, agent training effectiveness, customer loyalty index, interaction effectiveness, survey response rates, customer lifetime value (CLV), support ticket satisfaction, interaction channel efficiency, on-hold time |
Call Escalation Dashboard
A call escalation dashboard monitors instances where calls are escalated to higher levels of support or management. It provides live data on the reasons for escalations, the number of escalations, and the time needed to resolve them.
Using this dashboard, you can identify patterns and frequent issues that require escalation and make appropriate adjustments.
| Who it's for | Call center managers, customer service representatives, team leaders, supervisors, quality assurance teams, training coordinators, technical support teams, business analysts, reporting analysts, senior management |
| How often it's needed | Real-time, daily, weekly, monthly |
| Covered KPIs | Escalation rate, timeliness of issue resolution, FCR rate, agent escalation frequency, escalation outcome success rate, customer satisfaction post-escalation, escalation reason analysis, average handling time for escalations, tier-level escalation metrics, repeat escalation rate, resolution accuracy, customer effort score, agent performance in managing escalations, volume of escalations per team or department, escalation queue time, training effectiveness for escalation handling, escalation prediction score, adherence to escalation protocols, IT and system issues contributing to escalations, feedback from escalated calls, overall impact of escalations on service level agreements (SLAs), cost per escalation, impact of escalations on customer retention, and escalation reduction initiatives success rate |
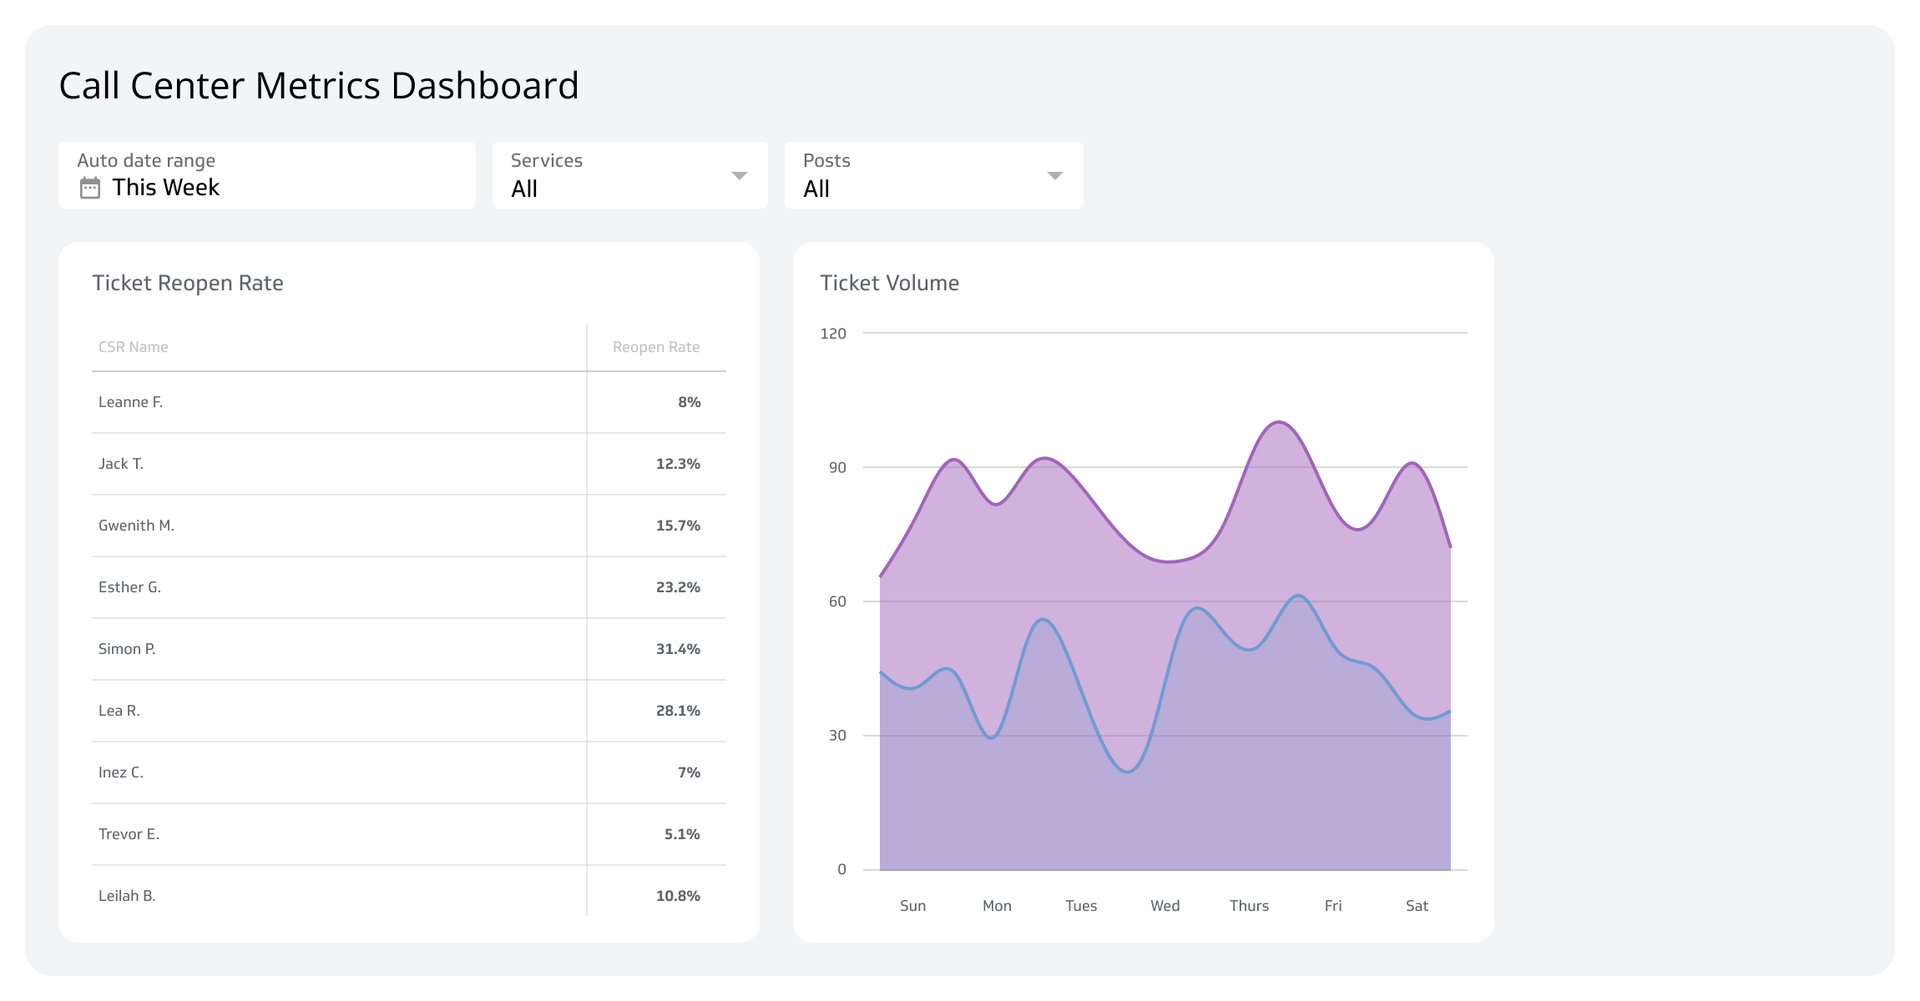
Helpdesk Dashboard
Helpdesk dashboards showcase data related to support ticket management and resolution. A well-built example provides real-time information on the number of open, pending, and resolved tickets, alongside metrics like average resolution time and CSAT scores.
A helpdesk dashboard improves your effectiveness at prioritizing agent tasks and identifying issues like system glitches, common customer complaints, and frequent questions.
| Who it's for | Call center managers, team leaders, supervisors, customer service representatives, quality assurance teams, technical support teams, training coordinators, business analysts, reporting analysts, senior management |
| How often it's needed | Real-time, daily, weekly, monthly |
| Covered KPIs | Ticket resolution time, first response time, customer satisfaction score (CSAT), FCR rate, ticket backlog, average handle time (AHT), agent productivity metrics, ticket reopen rate, escalation rate, service level agreement (SLA) adherence, number of tickets by category, volume of tickets by channel (phone, email, chat), agent utilization rate, ticket aging, resolution accuracy, customer effort score (CES), agent training effectiveness, number of escalated tickets, feedback from resolved tickets, cost per ticket, impact of helpdesk on customer retention, automation effectiveness, ticket prioritization accuracy, team workload balance, and incident and problem management efficiency |
Agent Performance Dashboard
Agent performance dashboards let you observe metrics behind individual and team productivity. They display real-time data on handling times and the daily number of calls each agent answers, alongside KPIs like first-call resolution rates and CSAT scores.
This dashboard helps identify whether an agent needs additional training. For example, if someone consistently has longer call handling times, the data makes that pattern visible quickly.
| Who it's for | Call center managers, supervisors, team leaders, customer service representatives, technical support teams, quality assurance teams, training coordinators, business analysts, reporting analysts, senior management |
| How often it's needed | Real-time, daily, weekly, monthly |
| Covered KPIs | AHT, FCR rate, CSAT score, call volume, call transfer rate, adherence to schedule, after-call work time, SLA compliance, call quality score, agent occupancy rate, agent availability, hold time per call, call abandonment rate, escalation rate, average speed of answer (ASA), agent attendance, ticket resolution time, call center shrinkage, agent turnover rate, coaching effectiveness score, agent utilization rate, training completion rates, peer feedback, customer feedback comments, performance scorecards, cross-selling and upselling success rates, agent engagement metrics, and overall contribution to team goals |
Customer Retention Dashboard
Customer retention dashboards measure customer loyalty and retention. They supply data on retention rates, which show the percentage of customers who remain with the company over a specific period. These dashboards also track churn rates and assess the effectiveness of retention initiatives.
This data helps you identify early signs of customer dissatisfaction and signals when to initiate follow-up calls or enhance loyalty programs.
| Who it's for | Call center managers, technical support teams, supervisors, senior management, customer service representatives, team leaders, reporting analysts, business analysts, training coordinators, quality assurance teams |
| How often it's needed | Real-time, daily, weekly, monthly |
| Covered KPIs | Customer churn rate, CLV, repeat call ratio, FCR rate, CSAT score, NPS, AHT, retention rate by customer segment, follow-up call rates, win-back rates, SLA compliance, agent performance impact on retention, cost per retained customer, customer feedback comments, loyalty program participation rates, account issue resolution time, escalation rate, customer complaint resolution rate, proactive service interaction rate, customer tenure length, retention campaign effectiveness, impact of retention training programs, customer communication preferences, agent training completion rates, customer exit survey scores, and overall customer happiness index |
Call Volume Analysis Dashboard
Call volume analysis dashboards track and scrutinize the number of calls made and received across various timeframes. They present information on peak call periods, average call durations, and fluctuations in call volume, helping you allocate resources where they're needed most.
These dashboards also uncover patterns in call traffic, such as seasonal increases or sudden spikes that may signal underlying issues or the impact of a promotion. Understanding these patterns lets you plan ahead and ensure the right number of agents are available at the right times.
| Who it's for | Call center managers, supervisors, team leaders, workforce management teams, reporting analysts, business analysts, senior management, technical support teams, quality assurance teams |
| How often it's needed | Real-time, daily, weekly, monthly |
| Covered KPIs | Total call volume, peak hour traffic, dials per hour, call distribution by day of the week, service level, average wait time, call abandonment rate, average handle time, average speed of answer, call queue length, call distribution by agent, call transfer rate, first call resolution rate, repeat call rate, call duration trends, inbound vs. outbound call ratios, call variance compared to forecast, agent occupancy rate, adherence to scheduling, call center traffic patterns, customer satisfaction scores, call source analysis, percentage of calls handled by interactive voice response (IVR) systems, call drop rate, call quality scores, agent workload distribution, and impact of marketing campaigns on call volume |
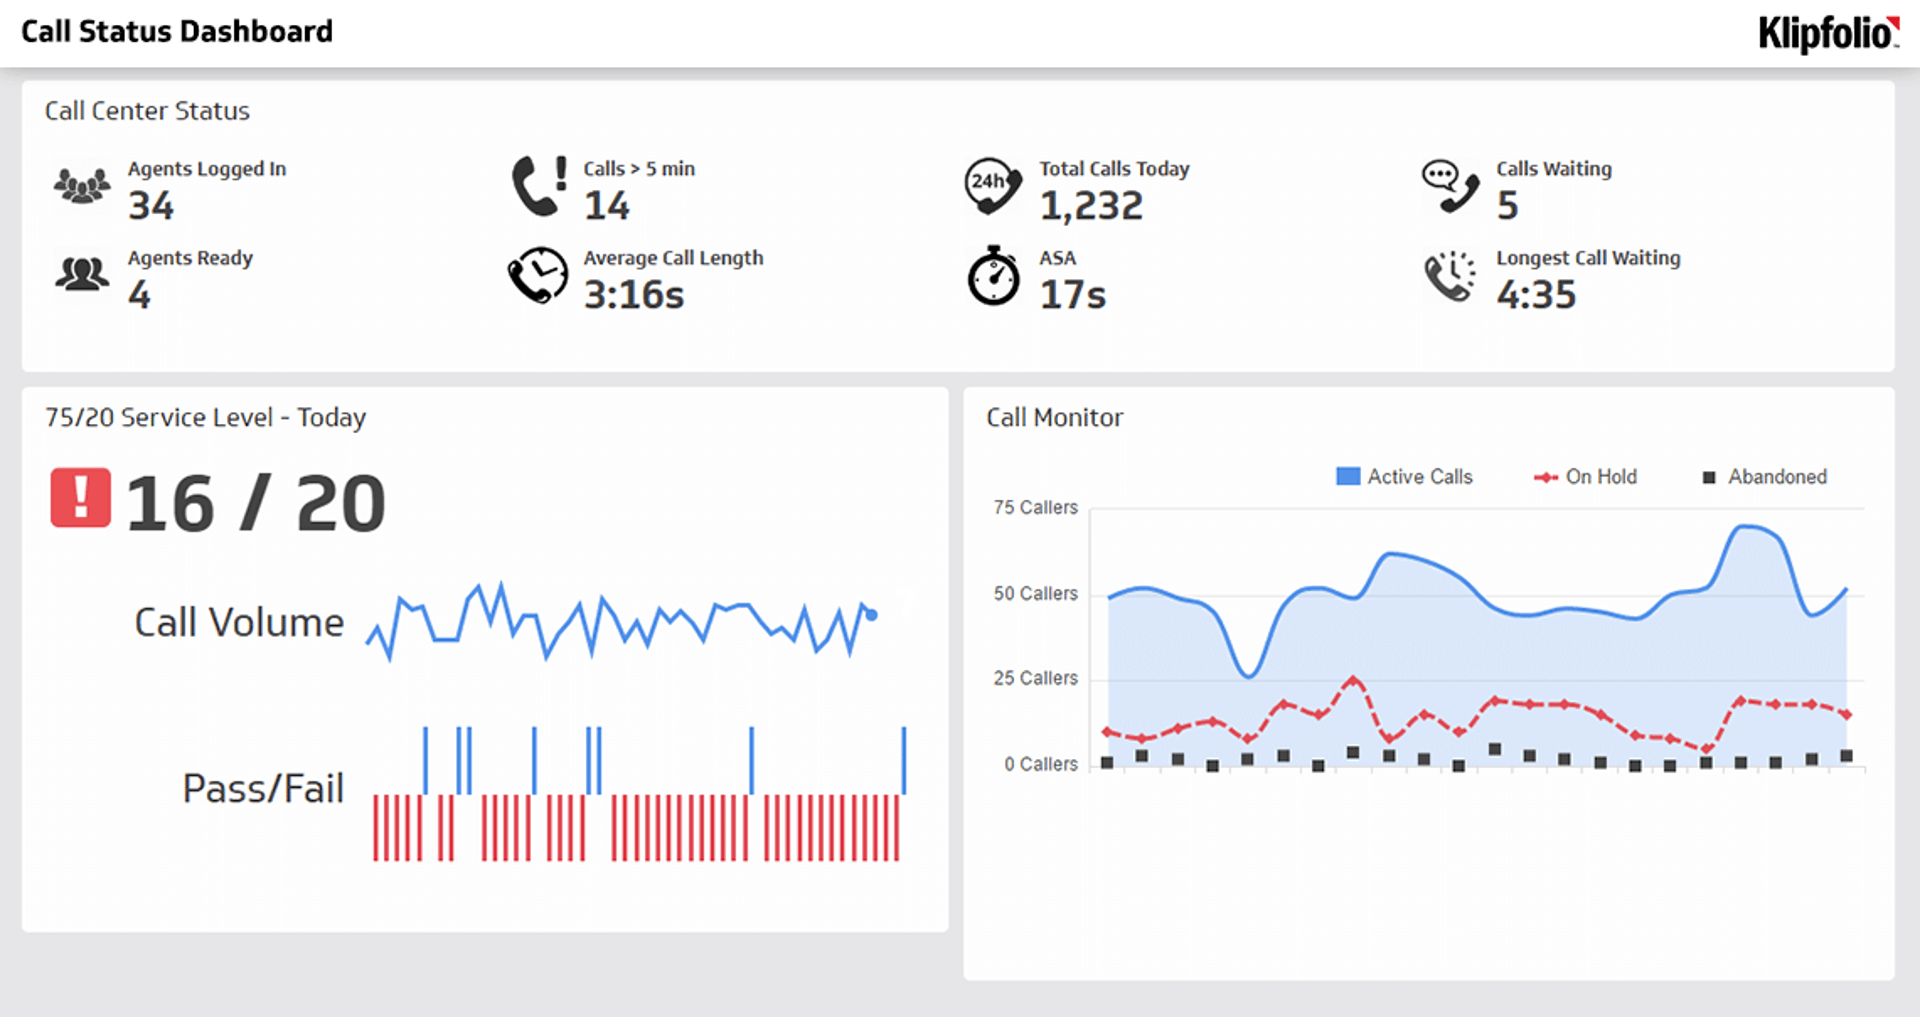
Call Quality Monitoring Dashboard
A call quality monitoring dashboard evaluates metrics related to the quality of customer interactions, such as call resolution rates, customer satisfaction scores, call quality scores, and adherence to call scripts or protocols. This dashboard lets you identify and address quality issues, such as long hold times or poor communication skills, before they affect the customer experience.
| Who it's for | Call center managers, supervisors, team leaders, quality assurance teams, training and development specialists, senior management, customer experience managers, reporting analysts |
| How often it's needed | Real-time, daily, weekly, monthly |
| Covered KPIs | Call quality scores, customer satisfaction ratings, first call resolution rates, average handle time, call compliance scores, agent performance scores, call monitoring frequency, call sentiment analysis, customer feedback and comments, issue resolution times, agent adherence to scripts, call escalation rates, training needs identification, call recording and review frequency, customer effort scores, call outcome analysis, agent coaching effectiveness, quality assurance pass rates, root cause of call escalations, customer churn rate linked to call quality, call auditing results, agent empathy scores, compliance with regulatory standards, post-call survey results, customer complaint trends, and overall service quality index |
First-Call Resolution Dashboard
First-call resolution dashboards measure how effectively customer issues are resolved during the first call. With them, you can gain insight into FCR rates and determine the percentage of customer inquiries addressed satisfactorily without needing follow-up calls or escalations.
The data from a first-call resolution dashboard helps you recognize early signs of inefficiency, such as declining FCR rates or increasing repeat call ratios, and signals when to implement training or refine procedures.
| Who it's for | Call center managers, technical support teams, supervisors, senior management, customer service representatives, team leaders, reporting analysts, business analysts, training coordinators, quality assurance teams |
| How often it's needed | Real-time, daily, weekly, monthly |
| Covered KPIs | FCR rate, repeat call ratio, issue resolution time, call transfer rates, CSAT score, NPS, AHT, escalation rate, agent performance impact on FCR, cost per resolved issue, customer feedback comments, training program effectiveness, SLA compliance, proactive service interaction rate, customer engagement metrics, customer complaint resolution rate, agent training completion rates, root cause analysis of unresolved issues, customer issue complexity, first contact resolution ratio by customer segment, time-saving techniques effectiveness, customer exit survey scores, overall efficiency index |
Agent Utilization Dashboard
An agent utilization dashboard offers deep insights into agent occupancy rates, which reflect the percentage of an agent's working time dedicated to managing customer interactions. It typically shows metrics like agent occupancy rates, call handling times, and workload distribution.
By checking this dashboard regularly, you can spot early signs of inefficiency, such as prolonged idle times or extended call handling durations, and make data-driven decisions on workforce scheduling.
| Who it's for | Call center managers, technical support teams, supervisors, senior management, customer service representatives, team leaders, reporting analysts, business analysts, training coordinators, quality assurance teams |
| How often it's needed | Real-time, daily, weekly, monthly |
| Covered KPIs | Agent occupancy rate, idle time, AHT, number of calls handled per agent, call transfer rates, CSAT score, NPS, adherence to schedule, after-call work time, agent performance scores, workload balance, SLA compliance, agent satisfaction rates, training program effectiveness, break adherence, call resolution time, ASA, agent absenteeism rate, customer feedback comments, call abandonment rate, agent interaction quality score, workforce scheduling efficiency, agent engagement metrics, overtime hours, overall efficiency index |
Build your call center dashboard with Klipfolio
Call center dashboards automate data collection and display the metrics that matter in charts, graphs, and tables. They stay current with scheduled data refreshes, so your team always has an accurate picture of performance.
Klipfolio Klips gives you the customizable dashboards you need to track your call center's KPIs, connect your data sources, and distribute reports to the right people. Try Klips free — no credit card required.
At a glance
Focus Area
Call center performance monitoring, KPI tracking, agent efficiency, customer satisfaction
Metrics List
Service Level, Call Resolution, Average Seconds to Answer, Cost per Contact, FCR Rate, AHT, CSAT, NPS, Agent Utilization Rate, Call Abandonment Rate
Reference Rate
Real-time, daily, weekly, and monthly depending on dashboard type
Related Dashboards
View all dashboards