Supply Chain Dashboard
Track your operational health with essential supply chain KPIs.
What is a supply chain dashboard?
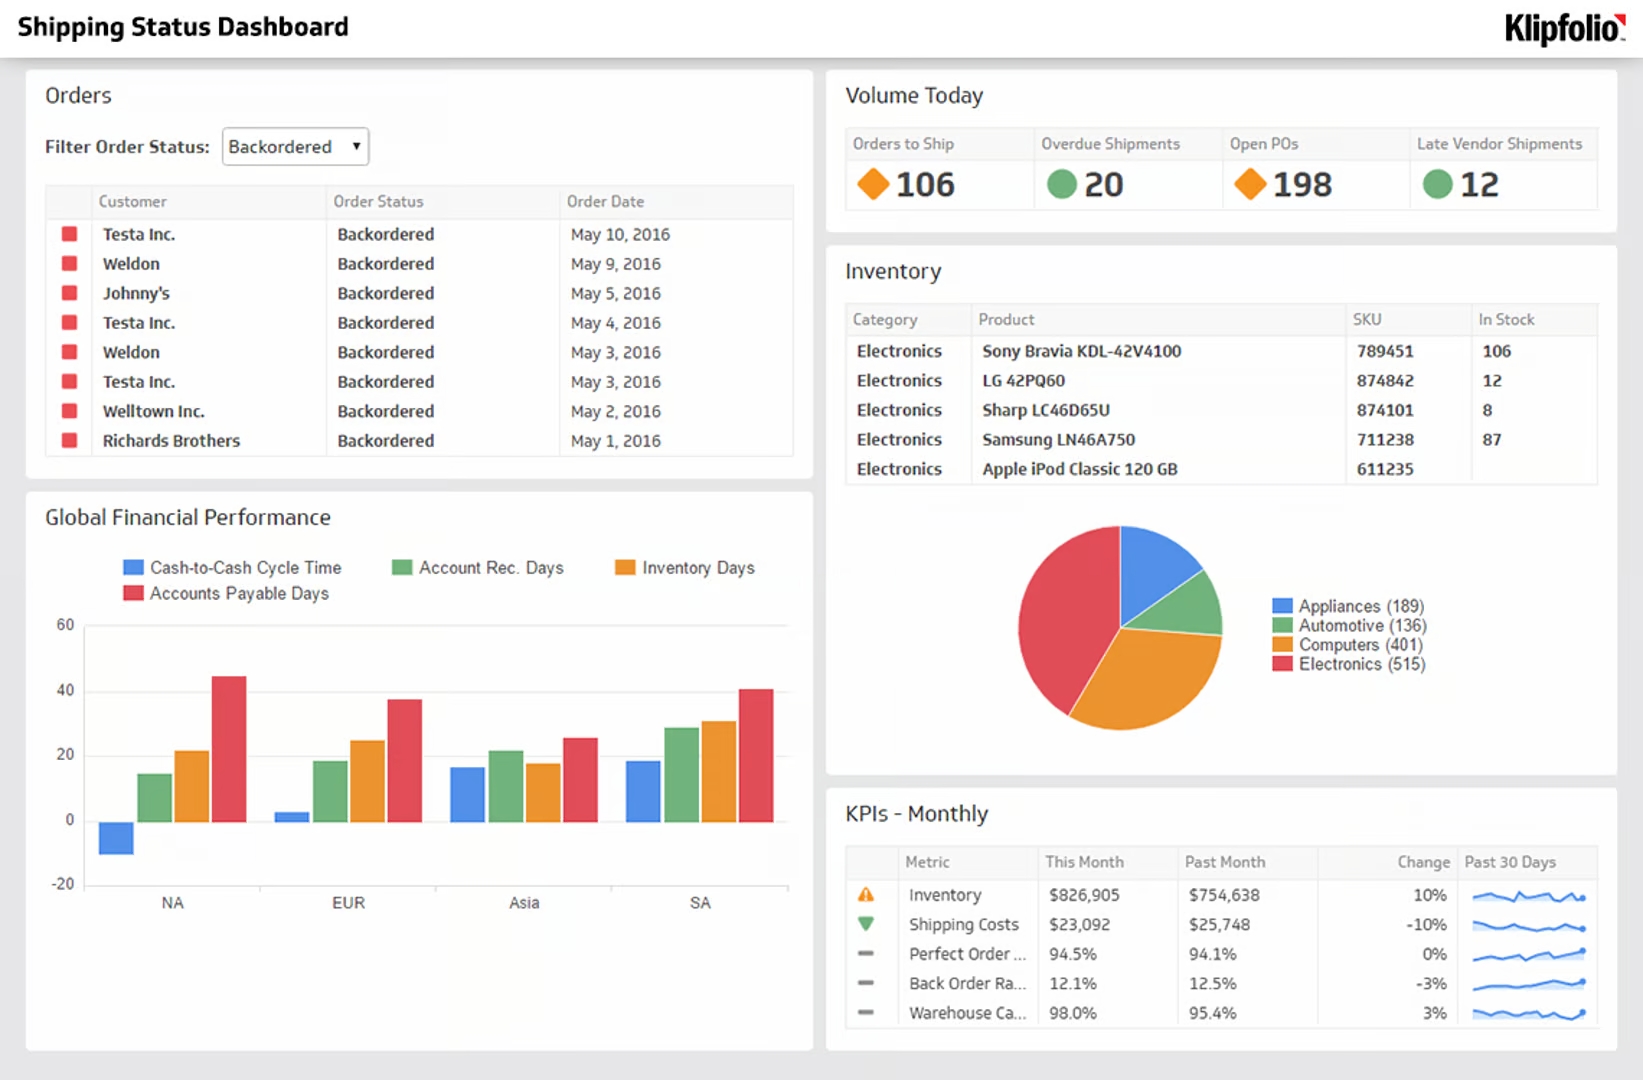
A supply chain dashboard is a reporting tool that tracks supply chain KPIs and metrics in a single, real-time display — giving you a visual overview of inventory, logistics, and warehouse operations.
Running supply chain operations on spreadsheets means manually connecting data from multiple sources, fixing errors, and chasing down updates. By the time a report is ready, the data is already stale. A supply chain dashboard automates that process, pulling everything into one place so you can spot inefficiencies, manage inventory, and make faster decisions.
This dashboard is built for leaders and managers in any company that handles physical goods — from growing consumer goods brands to established construction and materials firms.
- For smaller companies, it's the natural next step after outgrowing spreadsheets, eliminating manual work and reducing costly errors.
- For mid-sized companies, it creates a single source of truth that aligns procurement, inventory, and sales teams so everyone works from the same up-to-date information.
Key supply chain KPIs to track
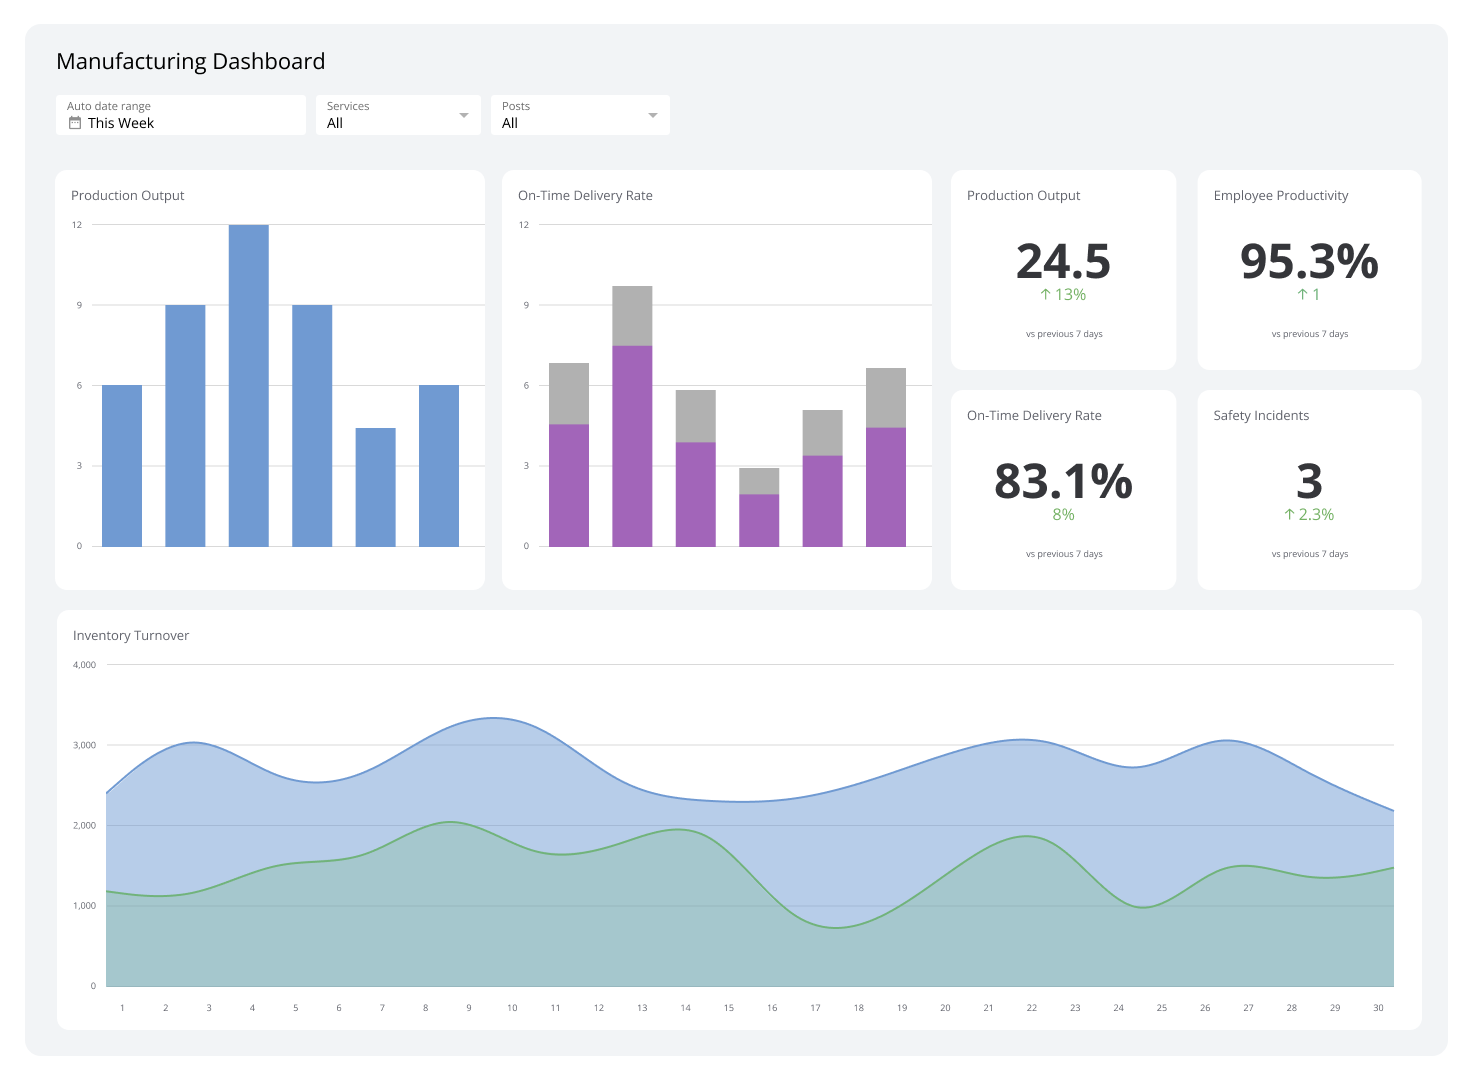
A strong supply chain dashboard goes beyond raw data points. It tracks KPIs that reveal the true health of your operations. Here are three essential ones to start with:
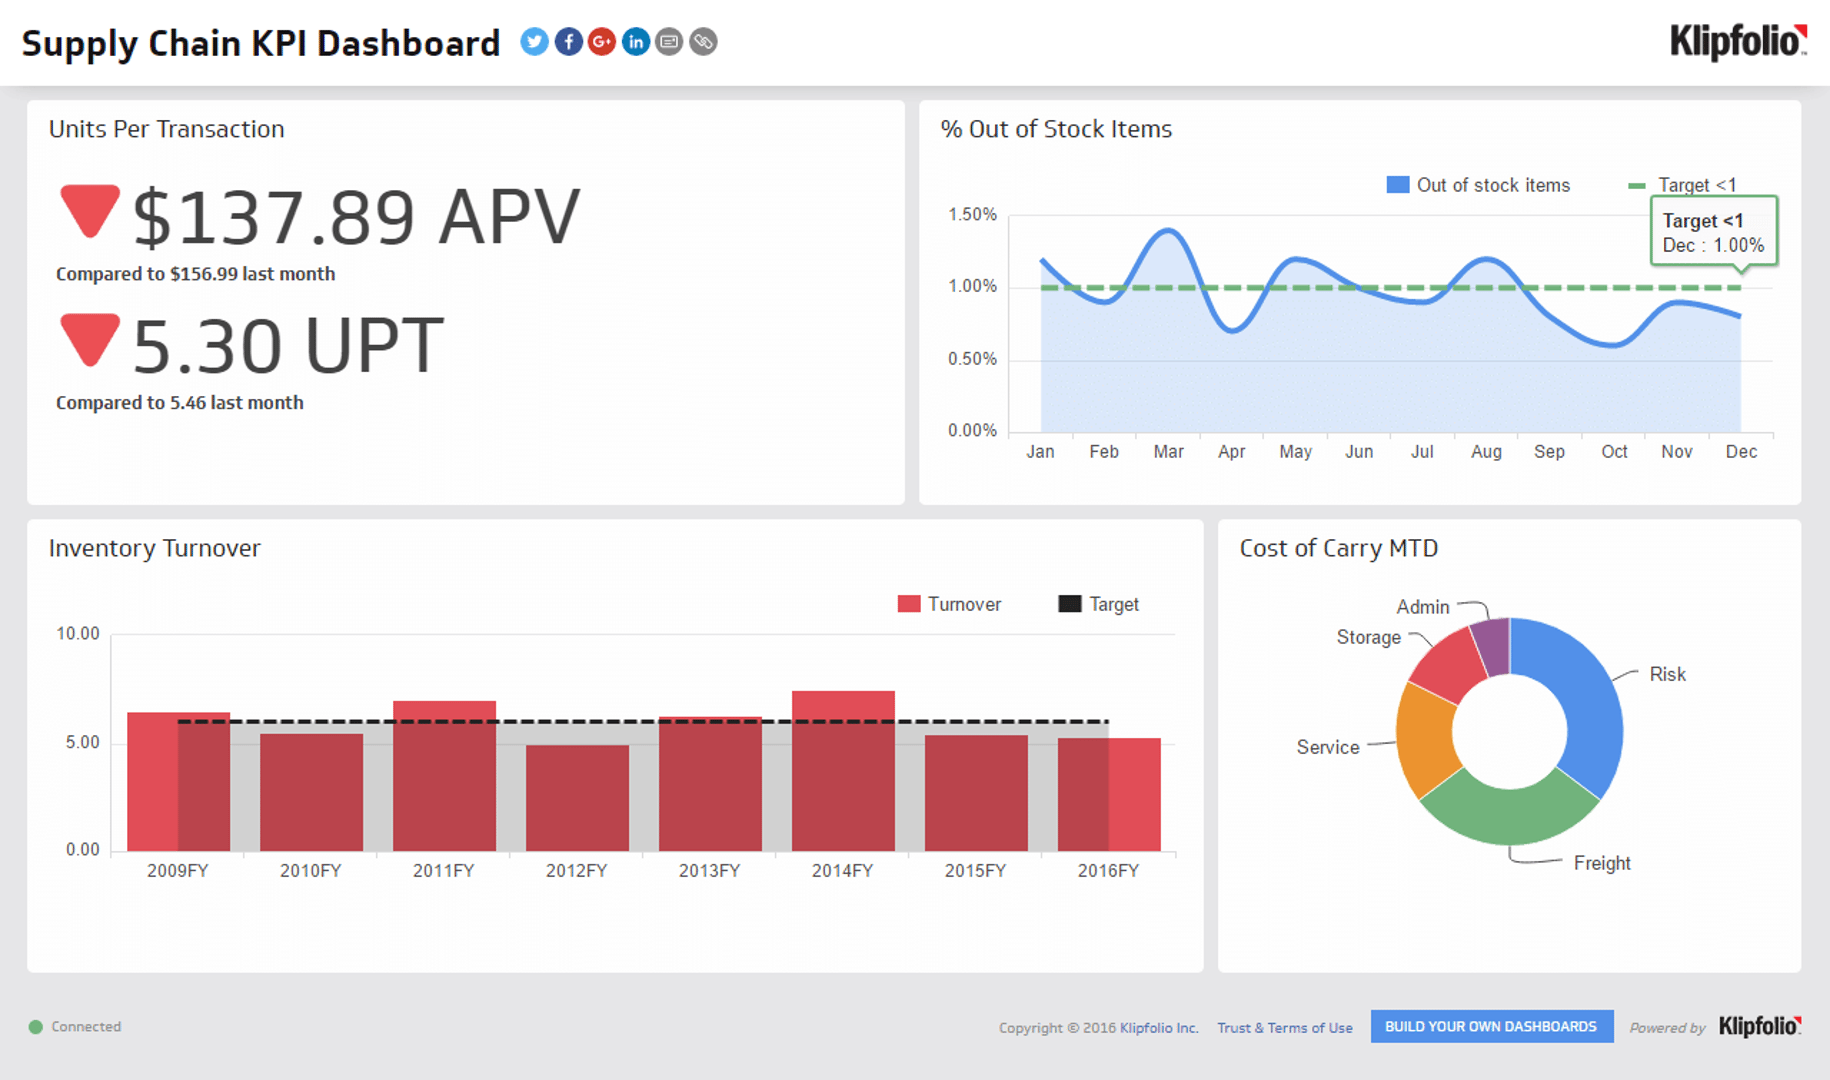
Units Per Transaction (UPT): Calculates the average number of items sold per transaction. Monitoring UPT helps you understand purchasing behaviour, measure the effectiveness of promotions, and identify cross-selling opportunities.
Inventory Turnover: Measures how many times your company has sold and replaced its inventory over a set period. A high turnover rate signals strong sales; a low rate may indicate overstocking or slow-moving product lines.
Inventory to Sales Ratio: Compares the value of on-hand inventory to total sales. A balanced ratio means you have enough stock to meet demand without tying up excess capital in unsold goods.
Why a centralized dashboard makes the difference
Tracking KPIs in isolation creates blind spots. When inventory data lives in one system, sales data in another, and logistics updates arrive by email, it's nearly impossible to see how each part of the chain affects the others.
A centralized supply chain dashboard connects those sources automatically. Metrics refresh on a schedule — from every minute to every 24 hours — so your team is always working from current data. Beautifully presented visuals make it easy to share performance with stakeholders, whether on a screen in the warehouse, a TV in the boardroom, or a scheduled PDF report.
When your data is in one place and automatically updated, you stop spending time on manual reporting and start focusing on decisions that move the business forward.
Build your supply chain dashboard with Klips
Klipfolio Klips connects to 130+ data sources — including APIs, SQL databases, and cloud storage — so you can pull supply chain data from wherever it lives. Use Excel-like formulas to model your metrics, choose from 30+ visualization types, and distribute dashboards to your team in the format that works best for them.
Get everyone on the same page. Start building your supply chain dashboard today.
At a glance
Focus Area
Inventory management, logistics tracking, and warehouse operations for companies handling physical goods.
Metrics List
Units Per Transaction (UPT), Inventory Turnover, Inventory to Sales Ratio
Reference Rate
Metrics can refresh from every 1 minute to every 24 hours depending on data source configuration.
Related Dashboards
View all dashboards