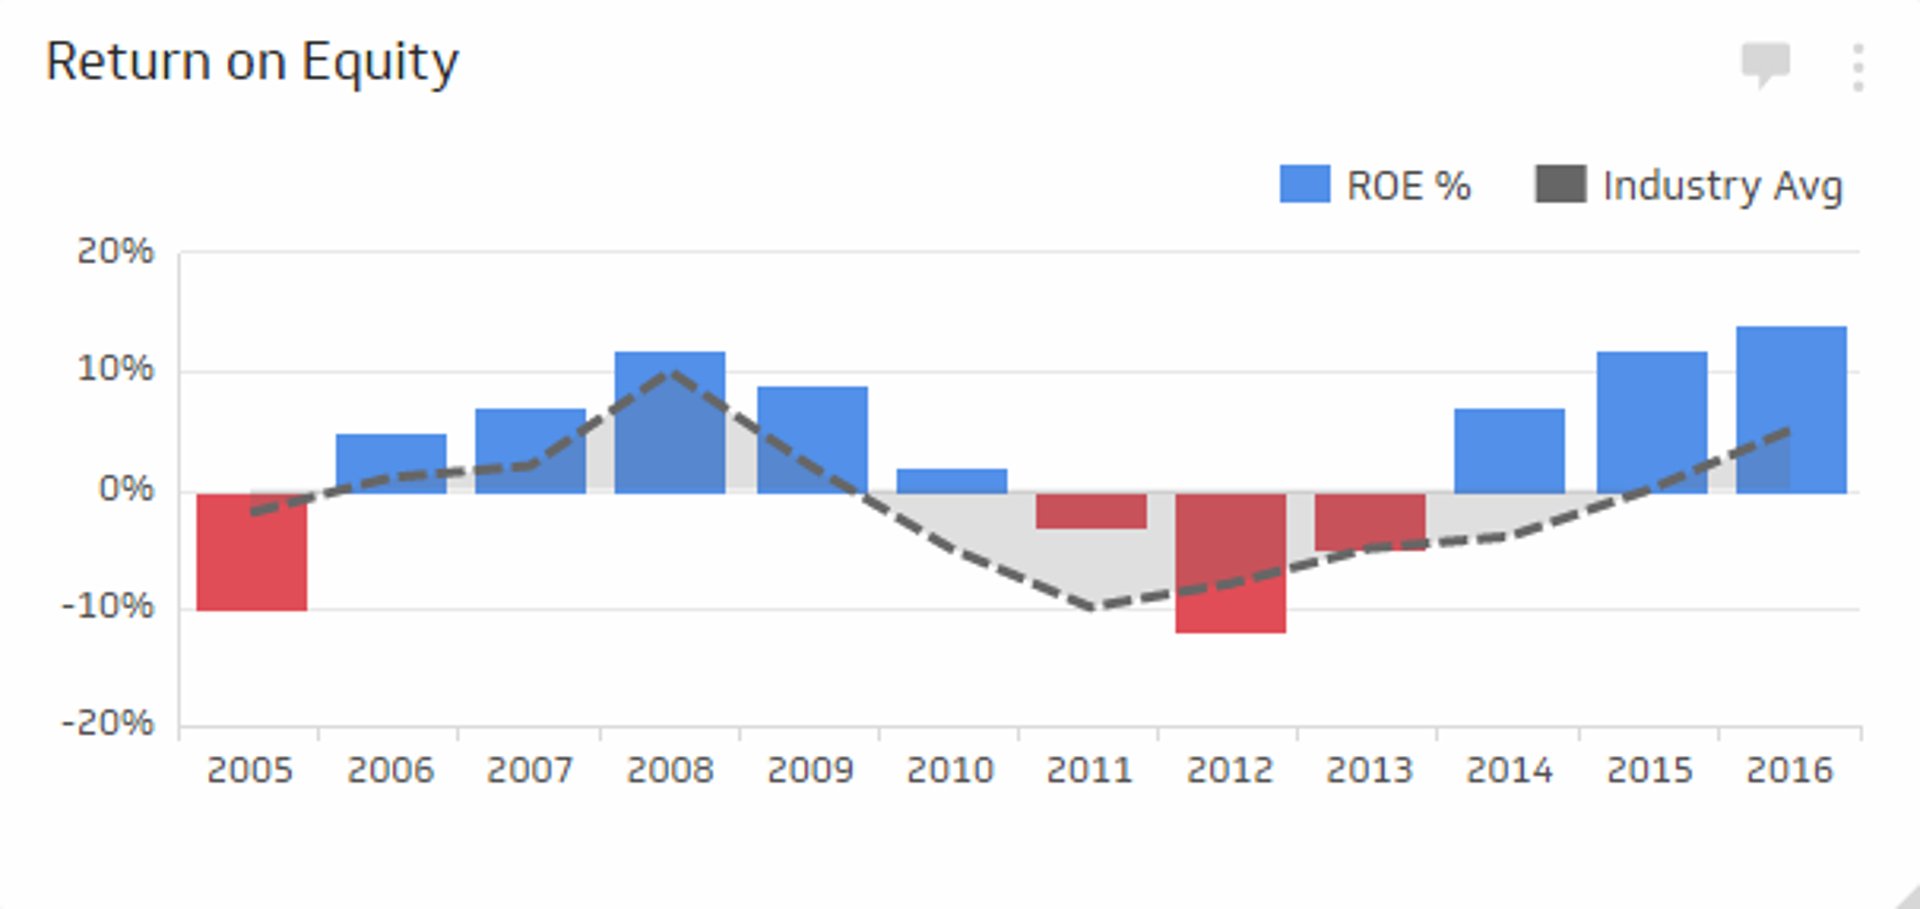
Return on Equity Metric
Measure profitability by examining your ability to generate revenue for each unit of shareholder equity.
Track all your Financial KPIs in one place
Sign up for free and start making decisions for your business with confidence.
What is Return on Equity (ROE)?
Return on Equity (ROE) measures how efficiently you generate profit from the money shareholders have invested in your company. In plain terms, it shows how much net income you produce for every dollar of average shareholders’ equity. ROE helps you judge profitability and capital efficiency together, which is why boards and investors track it closely.
Formula
ROE = Net income / Average shareholders’ equity
Average shareholders’ equity is: (Beginning equity + Ending equity) / 2. Using the average removes timing noise when equity changes during the period. Equity and net income come from your financial statements.
Reporting frequency
Quarterly and annually for formal reporting. Many finance teams also track a trailing?twelve?months view each month to watch trend direction between quarters.
Example calculation
Assume your company reported the following for the fiscal year:
- Net income: $4.8 million
- Beginning shareholders’ equity: $18.0 million
- Ending shareholders’ equity: $22.0 million
Average equity = (18.0 + 22.0) / 2 = $20.0 million
ROE = 4.8 / 20.0 = 24%
To deepen the analysis, apply the DuPont view: ROE = Net profit margin × Asset turnover × Financial leverage. If ROE rose because margin improved while leverage stayed flat, the quality of the increase is stronger than a rise driven only by more debt.
What is a good ROE?
It depends on your industry, capital intensity, growth stage, and accounting practices. Asset?light software companies can post higher ROE than capital?heavy manufacturers. Early?stage firms may run lower ROE while reinvesting heavily. Rather than chasing a universal target, compare yourself to close peers and track your own trend. Many mature companies aim for a mid?teens or better ROE through the cycle, but context matters more than any single threshold.
Why ROE matters
- Capital efficiency: ROE captures how well you turn equity dollars into earnings. It blends profitability and balance sheet stewardship.
- Investor confidence: Consistent ROE signals disciplined operations and can support valuation and access to capital.
- Strategic feedback: ROE helps you evaluate pricing, cost control, asset use, and leverage choices in one number.
- Decision guardrails: When you consider new projects or acquisitions, expected ROE vs your hurdle rate tells you if the idea clears the bar.
How to calculate ROE correctly
- Use average equity: Equity often changes during the year. Averaging start and end balances reduces distortion.
- Match periods: Pair full?year net income with average equity for the same year. For quarterly ROE, use quarterly net income and an average of beginning and ending equity for the quarter.
- Adjust for non?recurring items when analyzing trends: Unusual gains or losses can skew ROE. Track a “clean” ROE alongside the GAAP figure for management insight.
- Understand dividends and buybacks: Returning cash to shareholders reduces equity and can push ROE up even if profit is flat. Note these effects in commentary.
- Mind negative equity: If equity is negative, ROE becomes less meaningful. In that case, use alternative metrics such as return on assets and operating margin.
How to improve ROE responsibly
- Lift net income: Improve gross margin through pricing discipline and mix, control operating expenses, and reduce waste in processes.
- Use assets better: Tighten working capital, retire or repurpose under?used assets, and raise throughput on existing capacity before adding new.
- Focus the portfolio: Shift resources toward higher?return products and customer segments. Sunset offerings that consistently miss hurdle rates.
- Right?size capital structure: Within risk limits, an appropriate level of debt can improve ROE by reducing the equity base. Model interest coverage and covenants carefully.
- Return excess capital: If you cannot reinvest at attractive returns, consider dividends or repurchases while safeguarding flexibility.
Track ROE with margin, asset turnover, leverage, and free cash flow so you see both cause and effect. The goal is durable value creation, not a short?term boost.
How to monitor ROE in a Klips dashboard
Bring in your general ledger and balance sheet data and calculate ROE on a schedule that matches your close. Useful views include:
- ROE trend: Quarterly and trailing?twelve?months, with targets and prior?year comparatives.
- DuPont breakdown: Net profit margin, asset turnover, and equity multiplier next to ROE so you see which lever moved.
- Segment view: ROE by business unit or region using segment operating income and allocated equity.
- Capital actions: Callouts for dividends, buybacks, and equity raises that affected the denominator.
In Klips, create a data source for your income statement and balance sheet. Compute average equity with a formula, then divide net income by that value. Add annotations on periods with unusual items so readers have context. Distribute the dashboard to leaders by scheduled email, shared link, or TV mode to keep the discussion current.
Common pitfalls
- Using ending equity only: This can understate or overstate ROE when equity moves during the year.
- Ignoring leverage risk: Higher debt can lift ROE while increasing financial risk. Watch interest coverage and covenant headroom.
- Comparing across unlike industries: Cross?industry ROE comparisons can mislead because capital needs differ widely.
- Focusing on ROE alone: Pair it with return on invested capital, return on assets, and free cash flow to see the full picture.
Related metrics
- Return on Assets (ROA)
- Return on Invested Capital (ROIC)
- Gross Margin
- Operating Margin
- Debt to Equity Ratio
Audience
C?level, Finance Leadership, Board Members
Variations
Return on common equity, Trailing?twelve?months ROE, DuPont ROE
Looking for more finance KPIs? Explore the Financial KPI library and add ROE to your executive dashboard.