
Summary - The table component is one of the most versatile tools in Klips. Learn four best practices—simplicity, mini charts, results rows, and hidden columns—to create effective tables that help teams spot trends and make faster decisions.
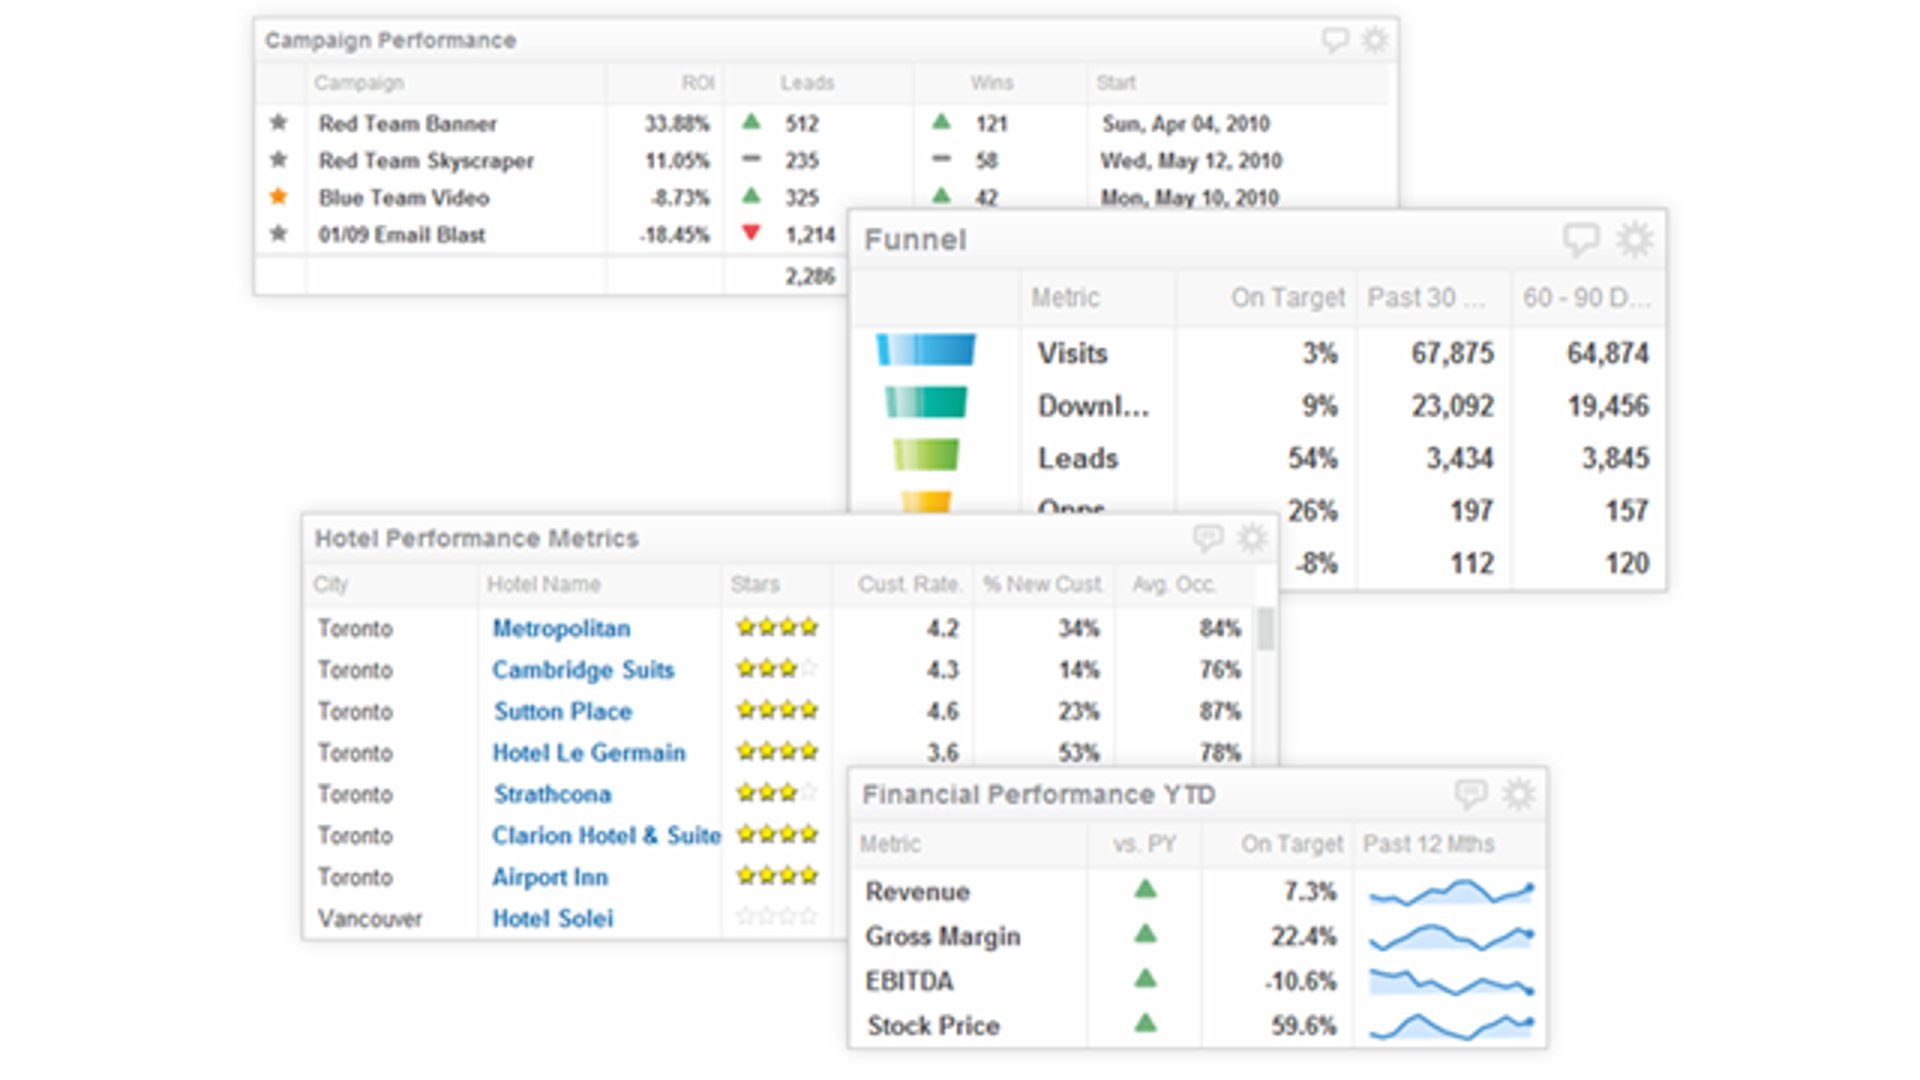
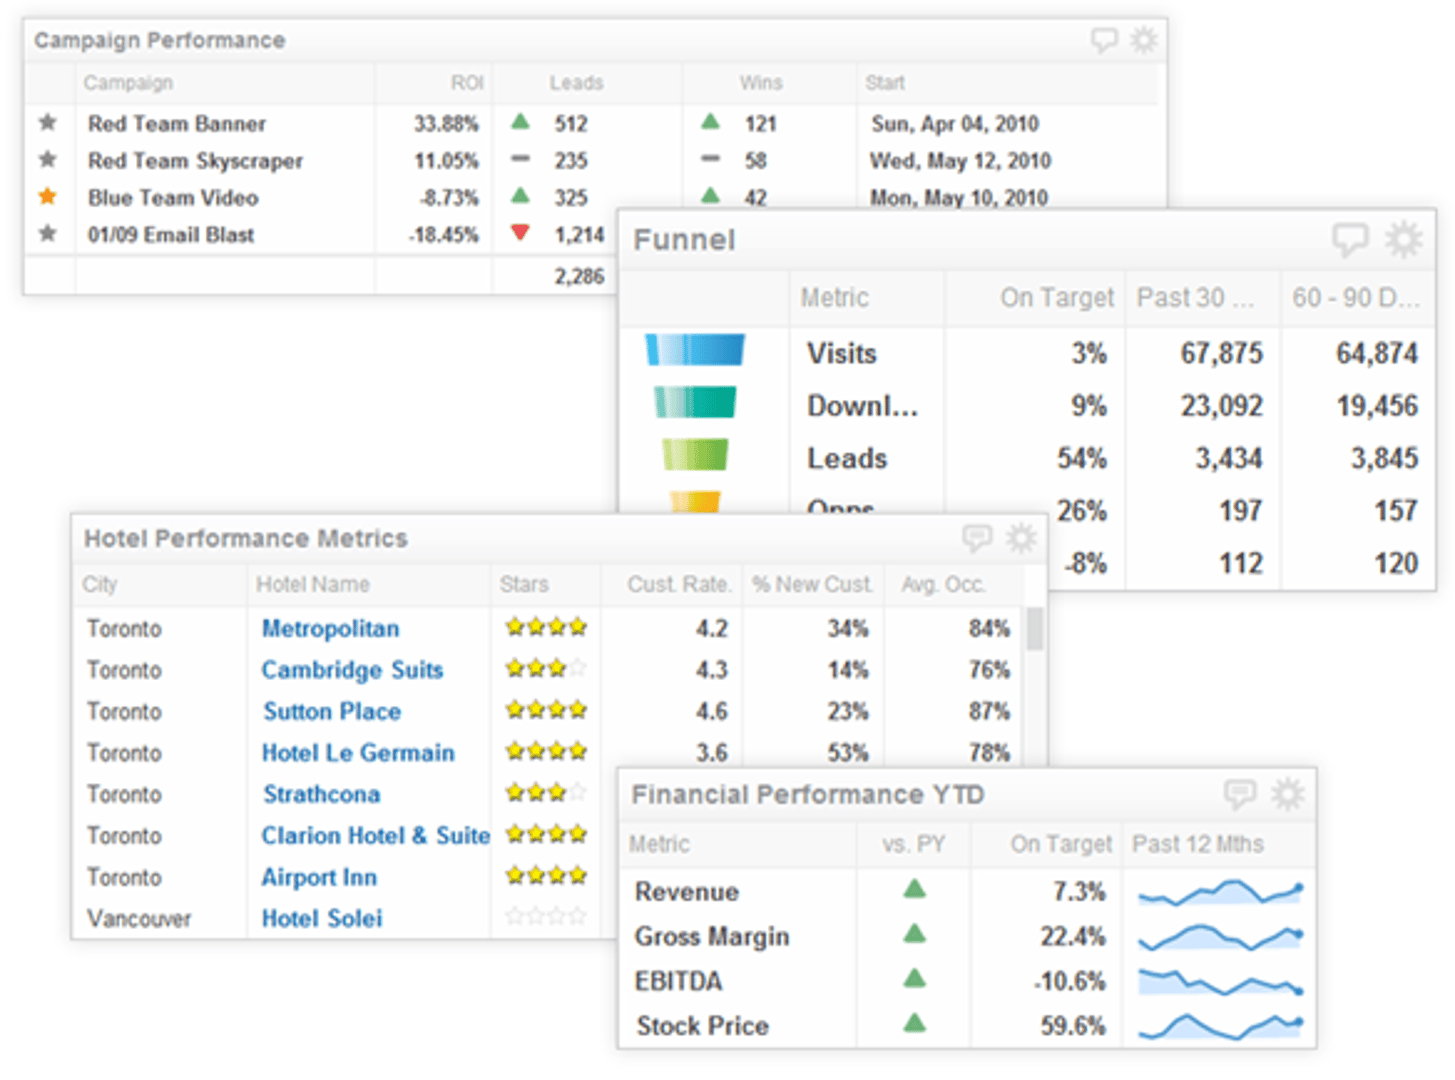
The table component is one of the most versatile tools in Klips. It's the equivalent of a Swiss Army knife—it has every tool you need. The table component can display bar and line charts, sparklines, bullet charts, currencies, numbers, text, hyperlinks, and even images.
Tables excel at displaying a wide variety of data types alongside contextual information. For example, you might want to show year-to-date (YTD) sales figures. With the table component, you can display that value alongside a sparkline showing performance over the past 12 months, all while comparing it to the previous year's revenue. This combination of metrics and visual context helps teams spot trends and make faster decisions.
Key features
- Results row with custom formula support
- Column borders, width, and alignment
- Full conditional indicator support
- Show text, numbers, images, links, or mini charts (such as sparklines or bullet charts)
- Column sorting and column reordering
- Text style, colour, and line wrap
Best practices for the table component
Here are four guidelines to help you create effective tables in Klips.
1. Simplicity
The key to a powerful table is providing context. Large tables are inevitable, but size is no excuse to ignore the golden rule of data visualization: clarity. The table component gives you ample opportunity to add context—whether in a corresponding row or column header.
When you design a table, ask yourself: Does a team member understand what they're looking at in five seconds? If not, simplify. Use descriptive column headers, format numbers consistently, and remove columns that don't directly support your core message. Stephen Few's work on data visualization reinforces this principle—every element should earn its place.
2. Mini charts
Mini charts like sparklines, spark bars, and win/loss charts are among the most powerful features of the table component. When used correctly, they add a layer of highly relevant context to your data. A sparkline can answer "How is this value trending over time?" A win/loss chart can show "How is this performing against a threshold?"
The only caution: ensure the mini chart adds real value and isn't included simply for visual appeal. Get started with mini charts in your table components.
3. Results rows
Results rows summarize column data using common functions—average, sum, max, min, or median. They become more important as your table grows, making it easy to spot totals or key metrics at a glance. You can also create custom results rows using formulas to summarize data from other components or external sources.
Always provide context for custom results rows. Use prefix and suffix options to label what the calculation represents, so viewers understand your intent immediately.
4. Hidden columns
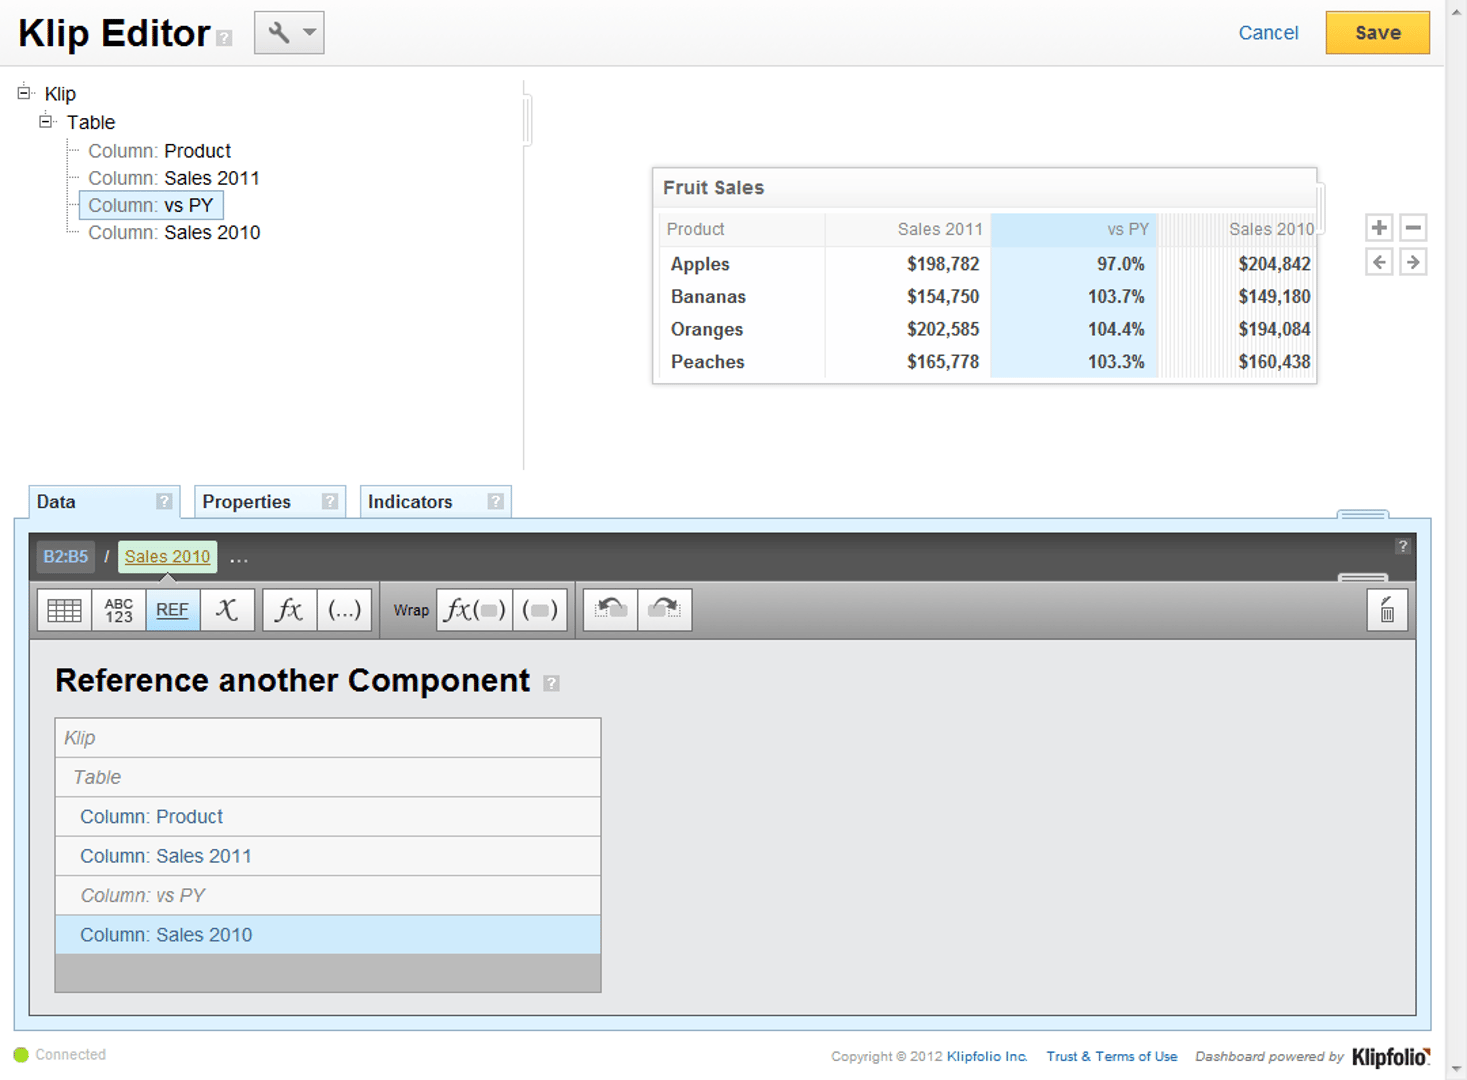
Hidden columns aren't immediately obvious, but they solve two common problems. First, use them to set up indicators that compare two columns without displaying one of them. For example, compare this year's revenue to last year's without showing the prior-year figure. Second, use hidden columns with component referencing to build formulas in other columns. If you're summing 12 months of sales data and want to reuse that calculation, reference the hidden column instead of rebuilding the formula each time.
What else can tables do?
The table component supports far more than these four practices. Tables also work with indicators, hyperlinks, and images—giving you nearly unlimited flexibility. In fact, there's so much you can do with a table that this won't be the last time we feature this component.
Ready to build? Head over to our support site to learn more about the table component.
Related Articles

10 Cloud BI Dashboard Tools for Small Businesses in 2026

6 dashboards I use daily to run my SaaS company
By Allan Wille, Co-Founder — April 10th, 2026
Klipfolio Partner How-To #1: Duplicating dashboards across client accounts
By Stef Reid — November 27th, 2025
