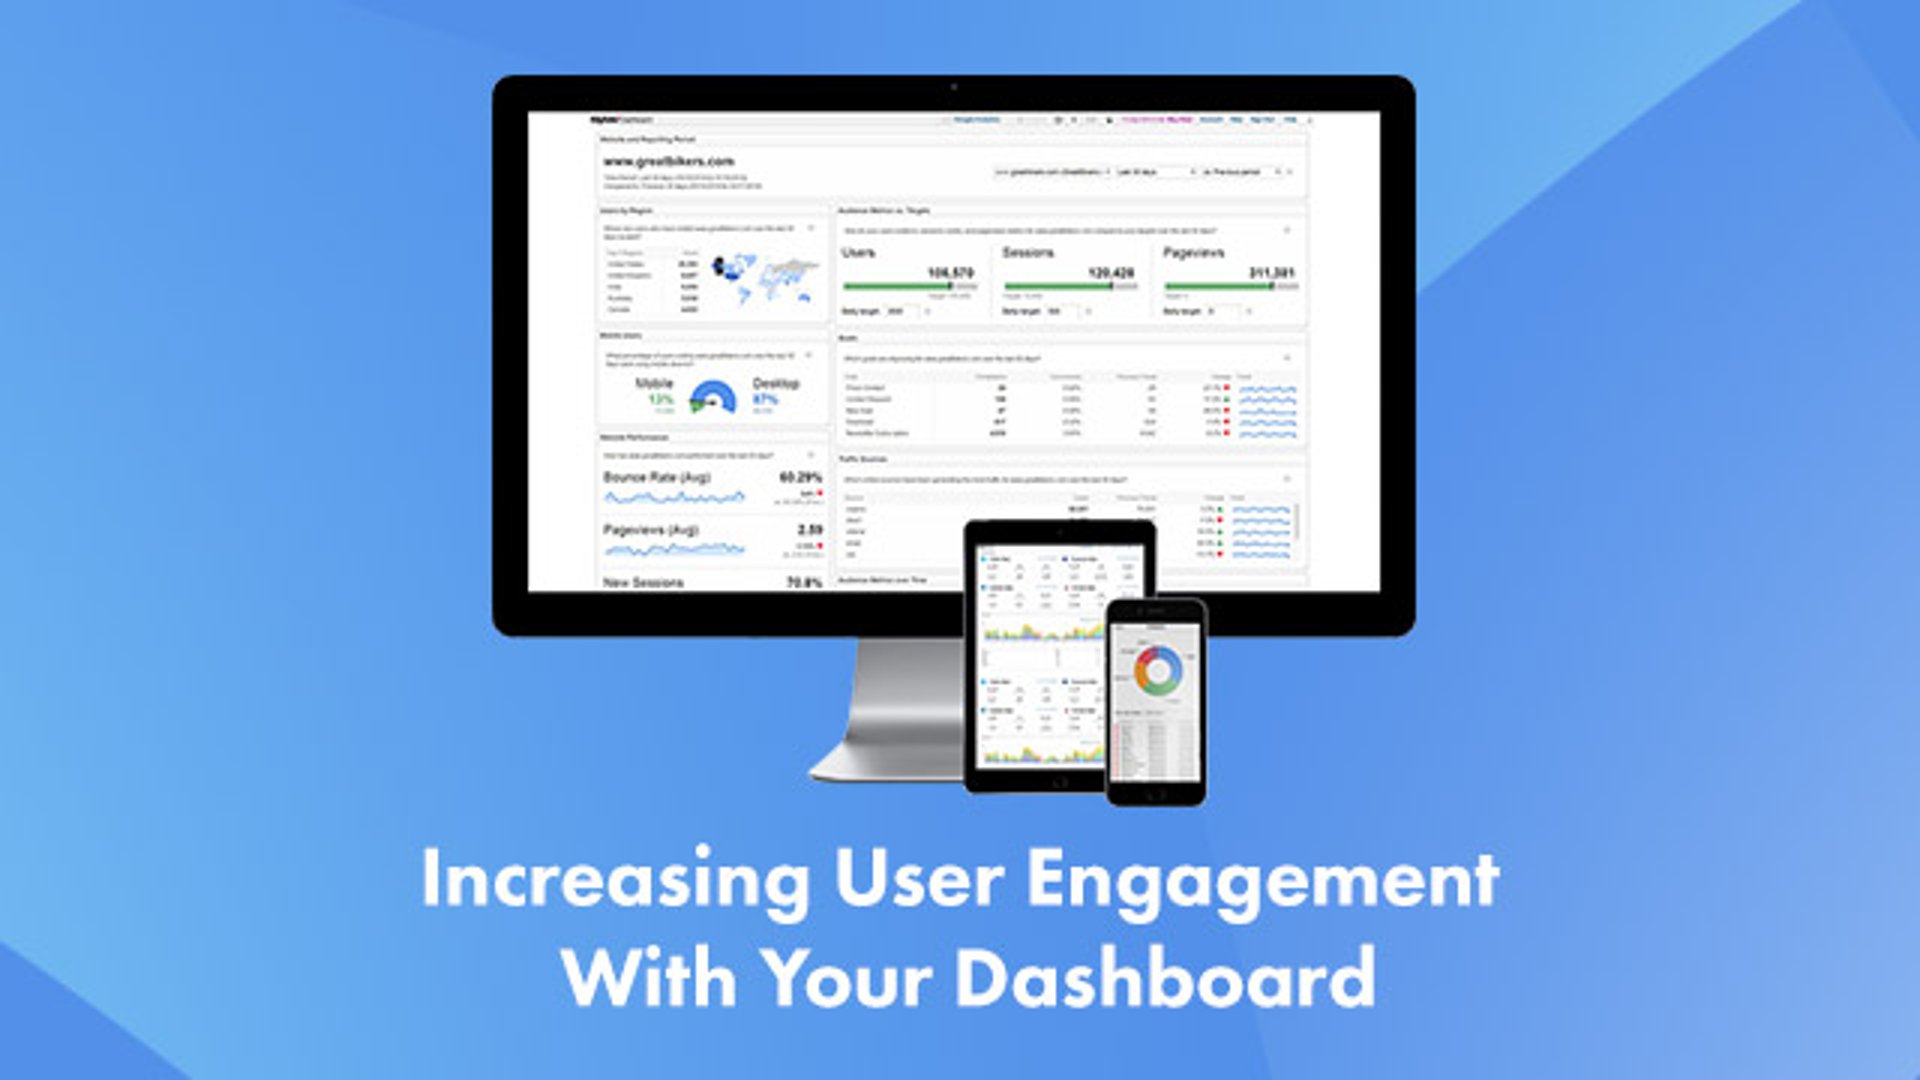

Summary - Boost dashboard adoption with three proven tactics: build interactive filters and controls, provide context through indicators and annotations, and use email reports as engagement teasers. Learn how to turn passive viewers into active users.
We've all experienced it: forgotten passwords, lost bookmarks, and the challenge of remembering which platform holds the metrics you need. With countless digital tools competing for attention, it's easy for users to fall into old habits and stop checking dashboards regularly.
As a dashboard builder, you understand that metrics matter. Yet spotlighting data isn't enough—if users don't engage with your dashboard, the insights stay hidden. Here are three proven tactics to boost user engagement and ensure your team stays informed.
1. Build interactive dashboards
A dashboard should be a live window into your organisation's performance, helping teams track the metrics defined by your organisation. Static dashboards, however, are just images. They may contain relevant data, but users can't filter, drill down, or focus on the specific metrics they need.
Interactive dashboards invite exploration. Instead of passive viewing, users engage directly with the data.
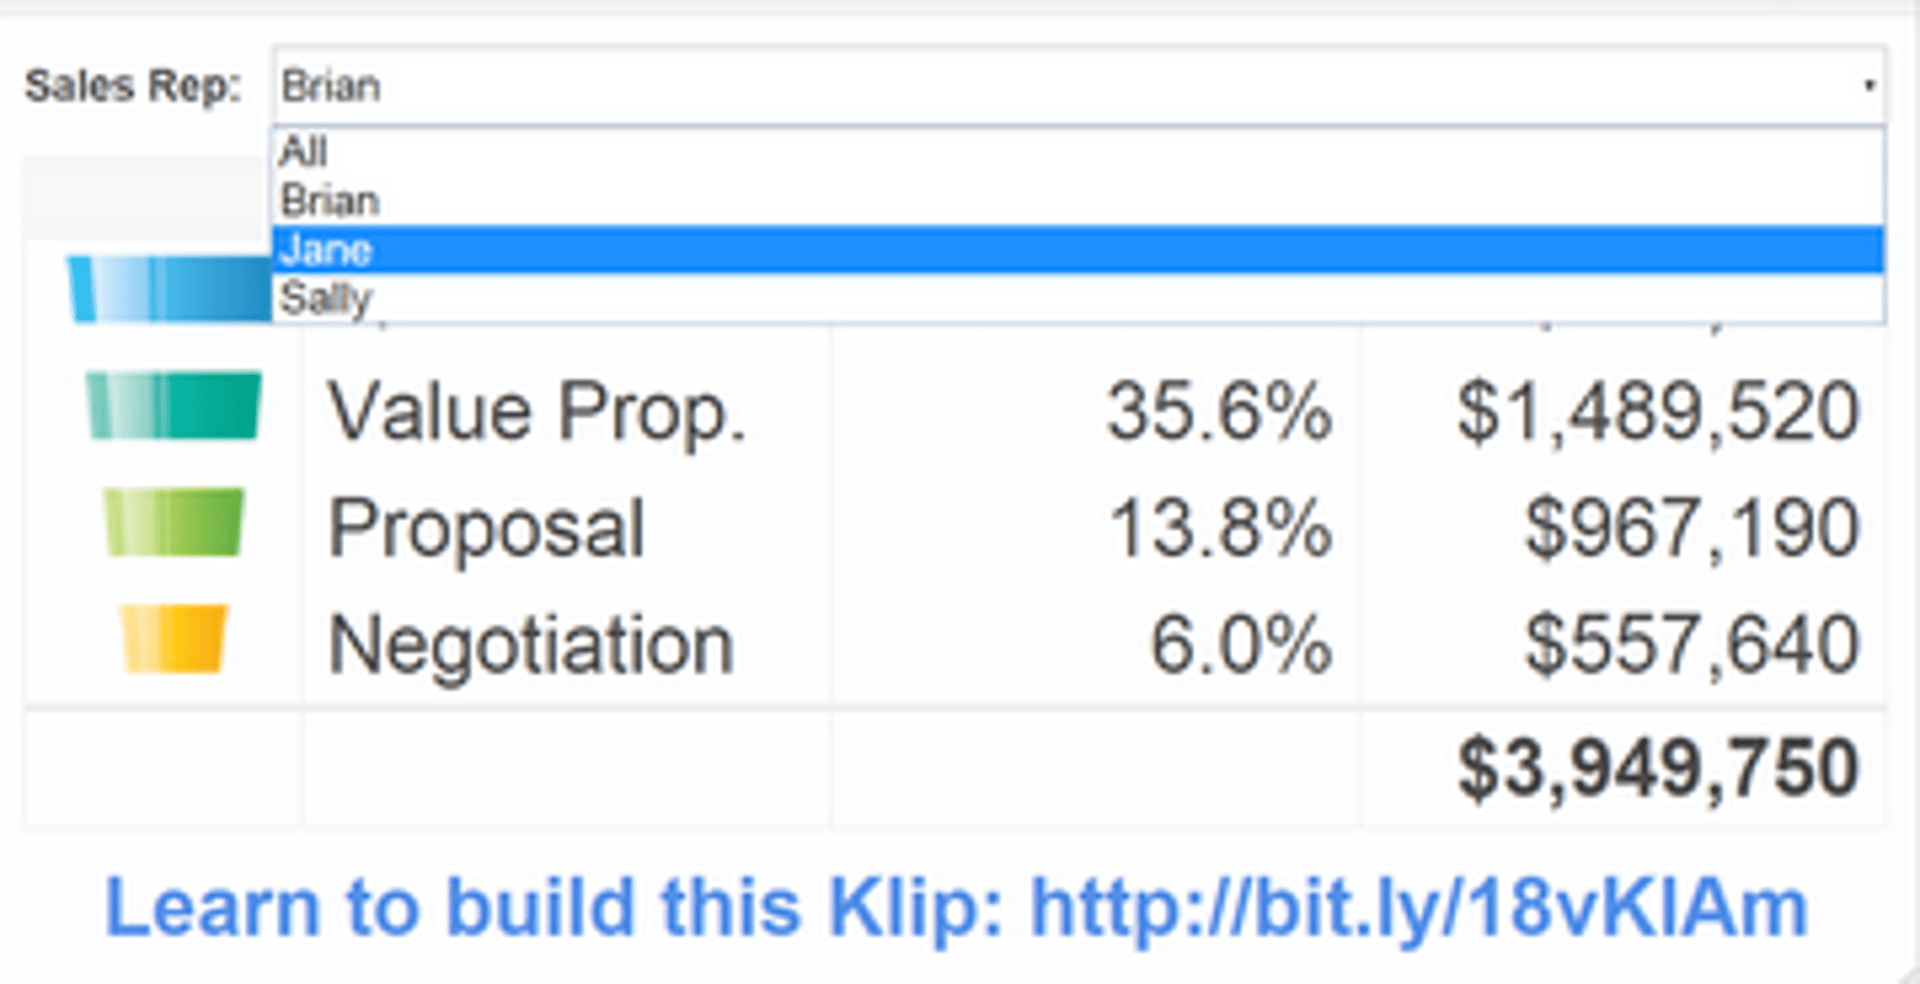
Add filters and controls to let users slice data by product type, team member, geography, or any variable that matters. Build a dropdown list so users can quickly narrow results. Add a date-picker to eliminate manual scrolling through long records. Use drill-down functionality in tables to show summaries with detailed views just a click away.
Interactivity transforms passive viewers into active participants. As the saying goes: "I hear and I forget. I see and I remember. I do and I understand."
2. Provide context and commentary
Never let data stand alone. A dashboard packed with numbers means nothing if users can't immediately understand what they're looking at.
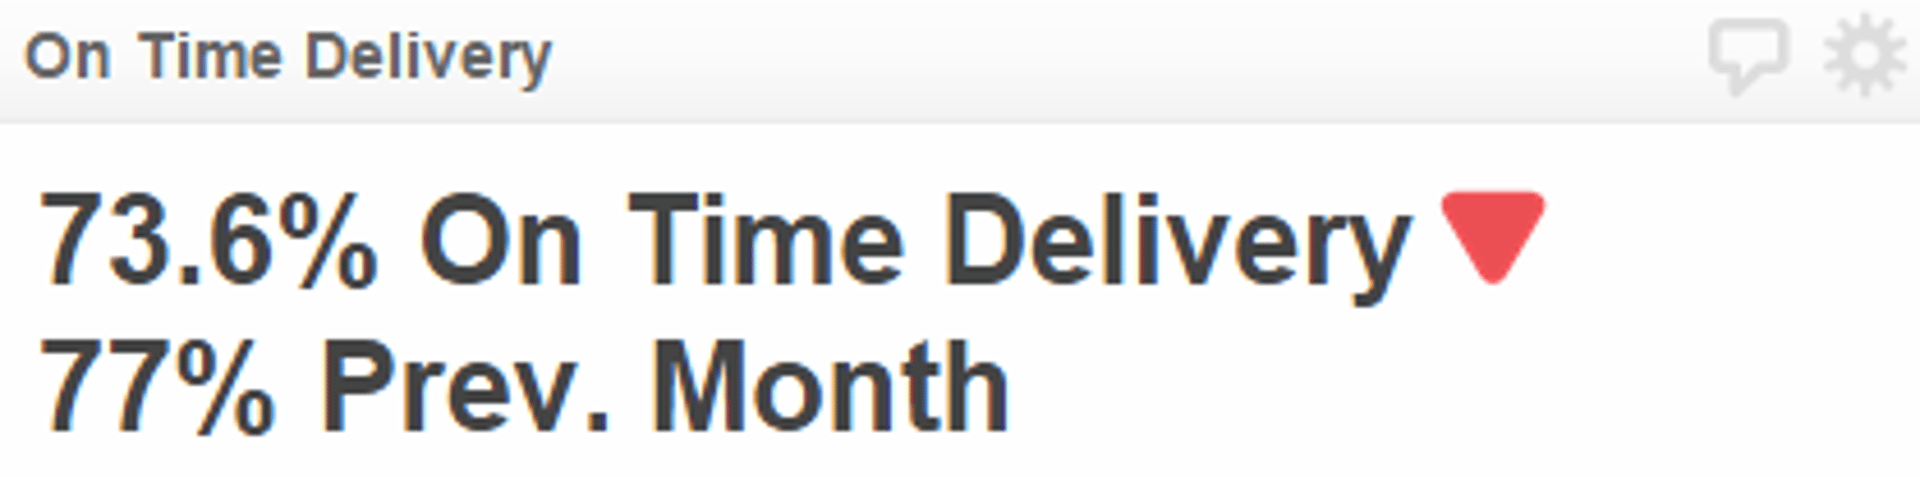
Consider this: if I see "50 units sold this month," my next questions are automatic. What did I sell last month? How does my performance compare to my colleague's? Preempt these questions by providing context upfront.
Use visual indicators to highlight the status of critical metrics. Add indicators to show whether performance is on track or needs attention. Display historical data alongside current figures to reveal trends. Use sparklines to show performance over time without consuming valuable screen space.

Enable team discussion through annotations. Let users add comments directly to your dashboard, sparking dialogue about what's happening and why. This transforms dashboards from reporting tools into collaboration platforms.
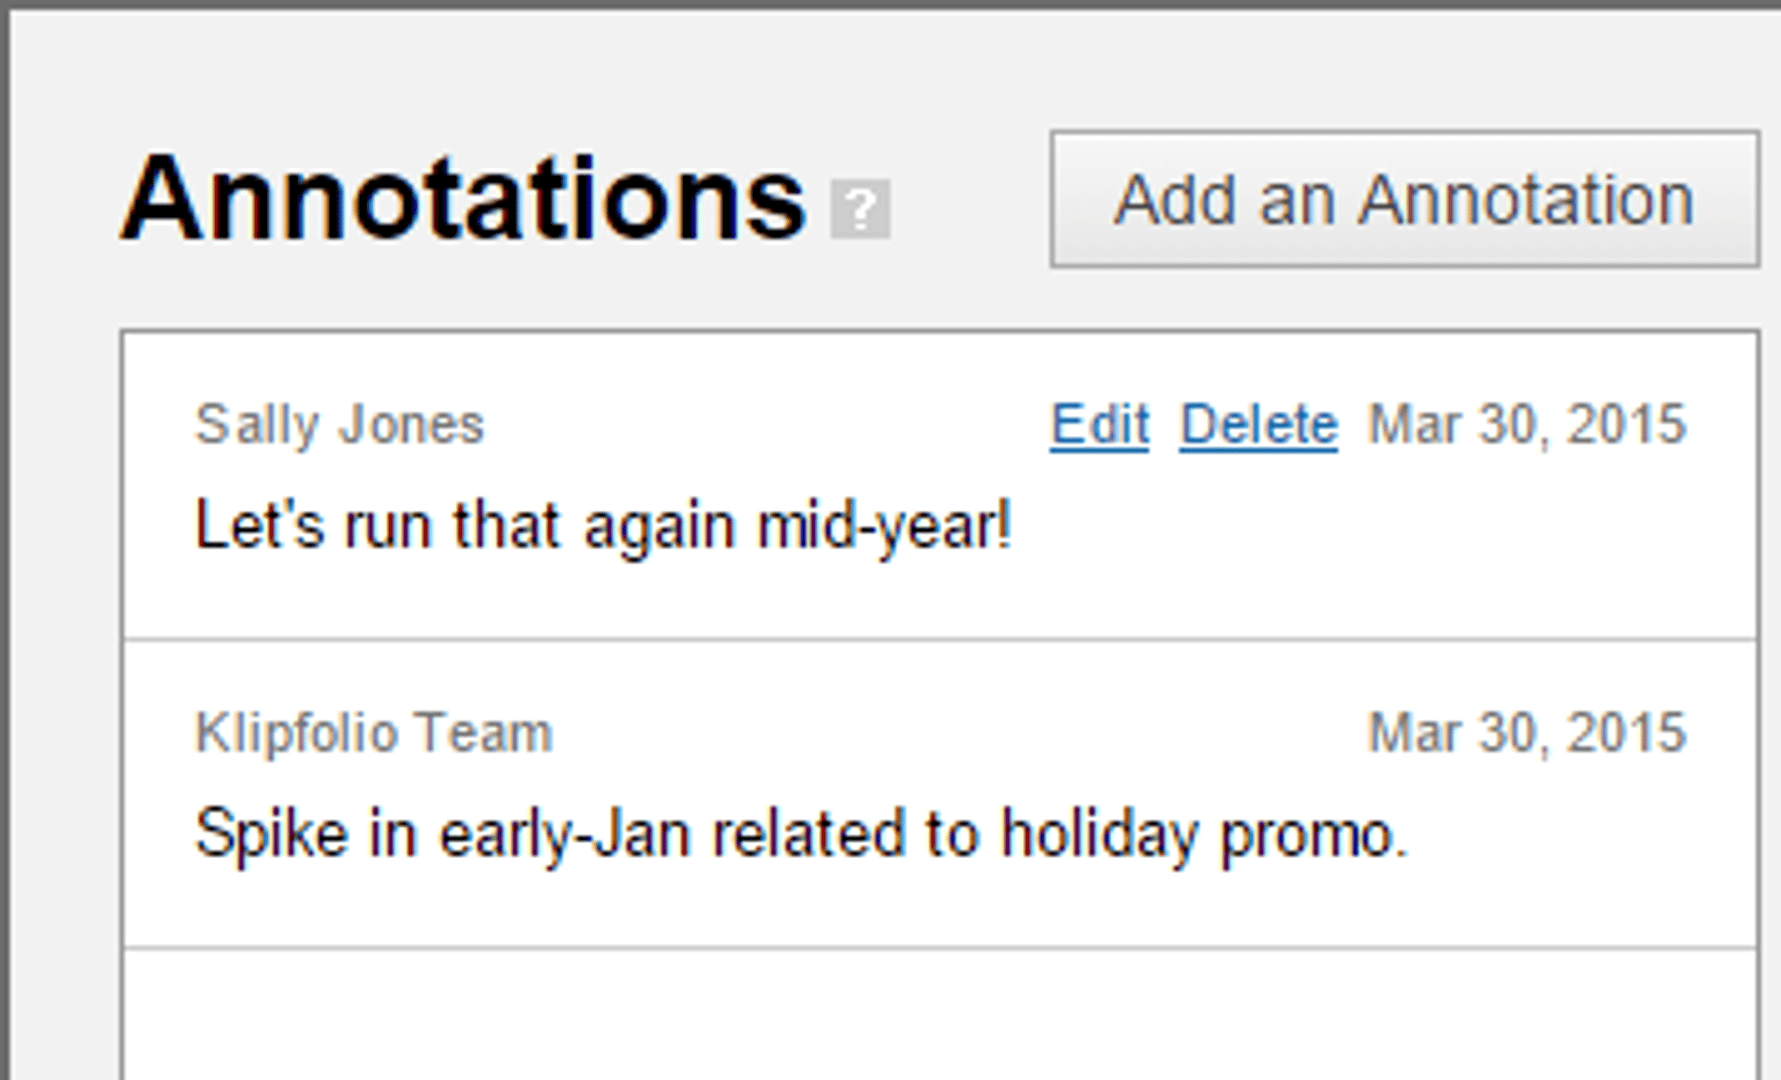
By default, "View Only" users cannot add annotations. Assign a custom role to users who should participate. When new users log in, they'll see a notification indicator showing that colleagues have commented, encouraging them to join the conversation.
3. Send summary reports by email
This might seem counterintuitive. Why email a snapshot when a live dashboard exists? Fair question. The best experience is always in the browser—but email reports serve a purpose: they remind users what they're missing and encourage login.
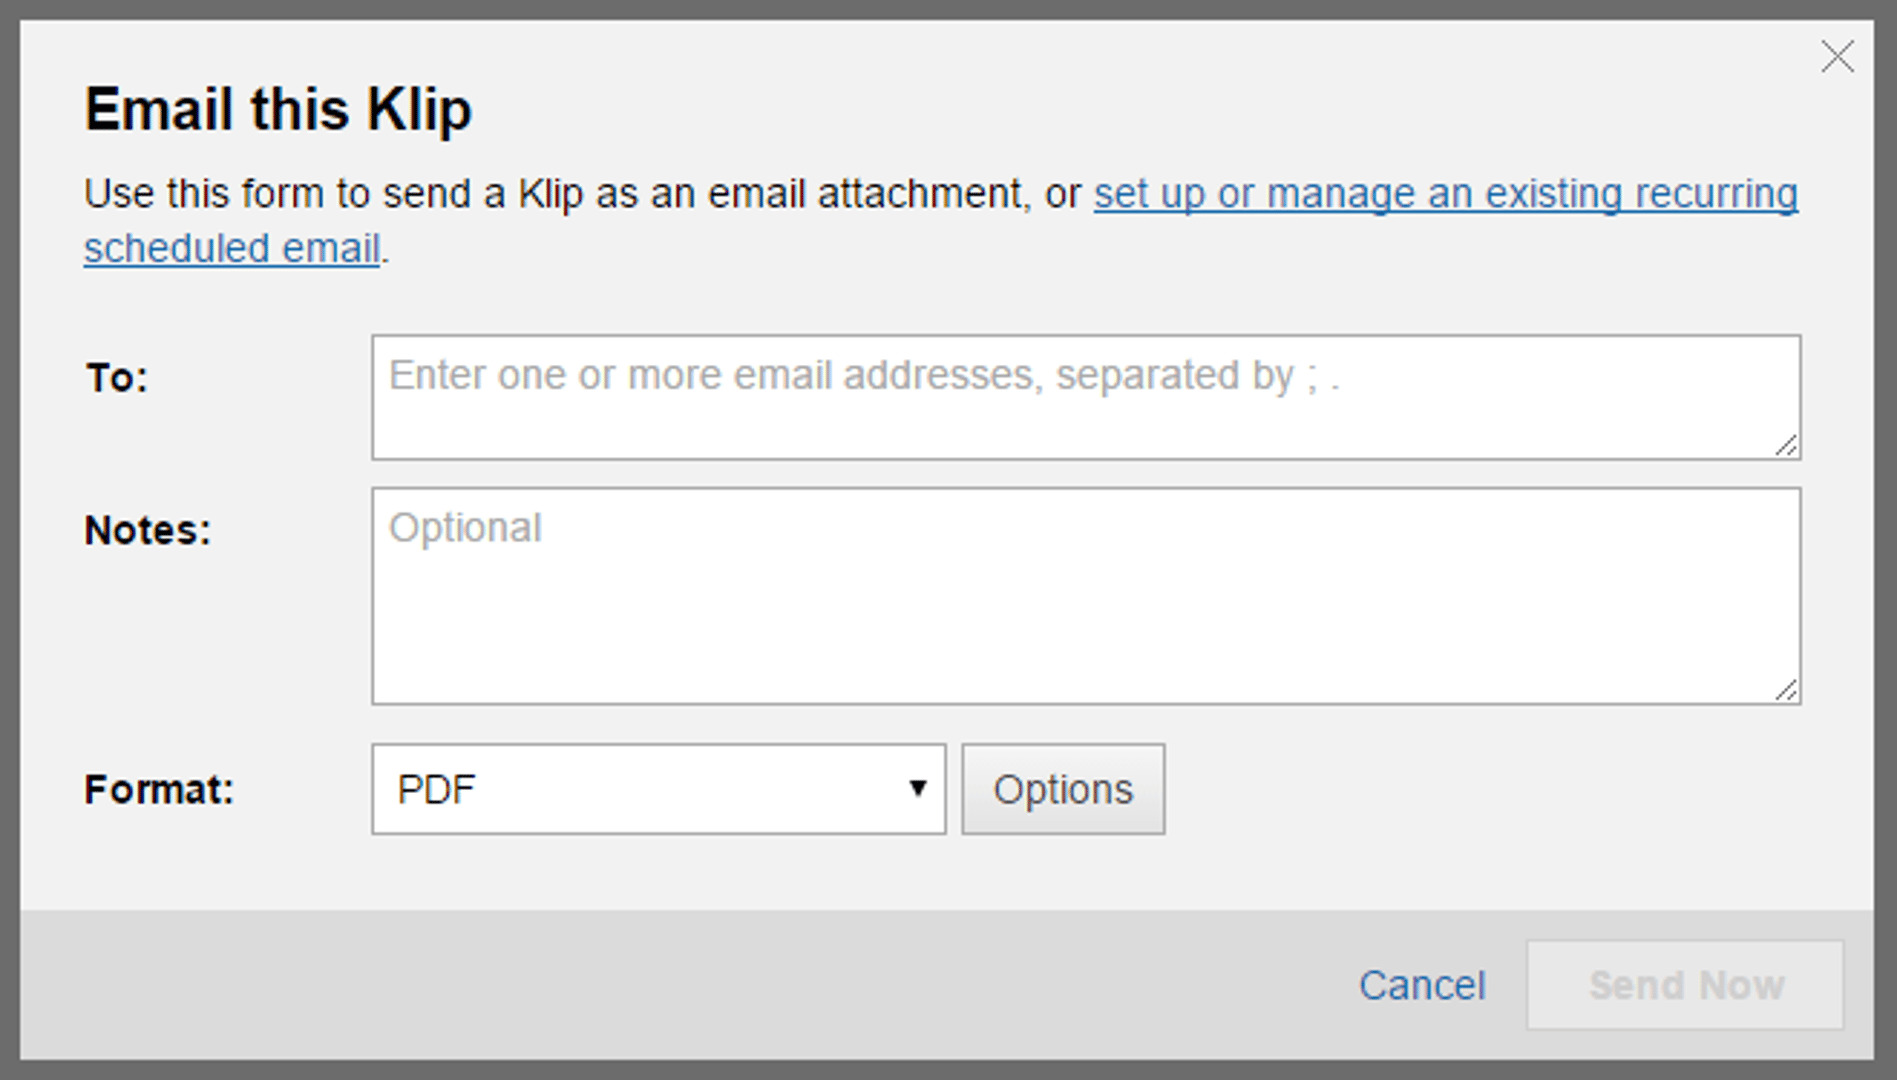
Think of email reports as teasers. Create a summary dashboard or tab that highlights only the most important metrics, stripping away granular detail. Send this report daily, weekly, or at a frequency that suits your team. Make it clear that the full story—with all interactive features and detailed data—is available by logging in.
Avoid the trap of over-reporting. Sending too much detail too often causes email reports to be ignored. Emailed reports also lack the rich interactivity and visual polish of the live dashboard. A focused overview, combined with a clear call to action, is far more effective at driving engagement.
Bring your dashboards to life
A well-designed dashboard deserves an audience. If your team struggles to break old habits and adopt a new platform, invest time in onboarding. Show them what they can access, explain the value, and apply these three tactics to turn passive viewers into engaged users who return regularly for the insights that matter most.
Related Articles

10 Cloud BI Dashboard Tools for Small Businesses in 2026

6 dashboards I use daily to run my SaaS company
By Allan Wille, Co-Founder — April 10th, 2026
Klipfolio Partner How-To #1: Duplicating dashboards across client accounts
By Stef Reid — November 27th, 2025
