

Summary - Master SaaS support with metrics that matter. Learn which KPIs to track at every level—agent, team, management, and client—to reduce churn and improve satisfaction.
Delivering world-class SaaS support requires a comprehensive approach. If your organization wants to give clients what they need when they need it, you must stay on top of service quality and resource allocation. This only happens when you examine data at every level of your organization.
The challenge: knowing which metrics matter. This guide provides a definitive list of support metrics you can track—whether you use chat, email, phone, or a mix. Each section offers metrics tailored to a specific role, from individual agents to business leaders. We've built example dashboards using Klips (our dashboard software) to show how these metrics work in practice using data from common support platforms.
By implementing these metrics, your team will build a solid foundation for improving customer service performance and reducing churn.
Why Support Metrics Matter: The Churn Problem
Most SaaS companies face a churn crisis. Churn happens when an initially enthusiastic customer loses confidence that your software delivers results. If a customer loses confidence in your support, they'll stop using your product and explore competitors.
Research shows that 5–7% annual customer churn is acceptable. Yet 70% of SaaS providers operate at much higher rates, representing massive revenue loss.
This statistic damages individual providers and the industry as a whole. It signals that many SaaS businesses don't prioritize customer experience. We can do better.
You can stay on top of customer experience. You can provide ongoing, high-quality support that users find valuable. But that support must be grounded in data. You need to know which parts of your service work well and which need adjustment. You need to see where your support team wins and where it struggles.
These metrics help you build world-class support. Establishing them early strengthens your customer service processes and helps your team improve quickly.
Six Pain Points Driving Customer Churn
Research from Chargify identifies why customers leave after purchase:
Poor support for initial goal achievement. If a client can't resolve their core issue quickly, they're unlikely to return. Speed matters.
Poor follow-up. SaaS products require ongoing support to stay valuable. Without active follow-up, you miss chances to ensure satisfaction.
More attractive competitor offers. You can't control what competitors offer, but you can improve your service quality to become more attractive and retain more customers.
Losing key clients. Influential clients have outsized impact. When they leave, others often follow.
Inadequate product features. A weak product drives customers away. Gather feedback and develop proactively to avoid this trap.
Mismatched support style. Different clients need different approaches. Get to know your clients and tailor your support accordingly.
The Common Thread: Data-Driven Decision Making
Notice the theme: gaining knowledge through data. Without solid understanding of your product's effectiveness and your clients' specific situations, you cannot retain customers or build a healthy client base.
Data comes from measuring customer interactions and interpreting them. The metrics below let you track support performance at five levels: agent, team, management, client, and overall business impact. This structure helps every role see their contribution to support excellence.
The goal is to give you tools to gather necessary information and implement robust, data-driven service protocols. We've included example dashboards built with Klips that you can deploy at each level, making it easier to consume data quickly.
Agent-Level Metrics
These metrics are owned and tracked by individual agents. They show performance the agent directly controls.
| Metric | Description |
|---|---|
| Chats Completed | Number of chats handled by the agent |
| Customer Satisfaction Score | Score from post-chat surveys sent to customers |
| Internal QA Score | Quality score assigned by internal staff |
| Handle Time | Average duration per chat |
| Open Tickets | Number of unresolved tickets the agent initiated |
| Ticket Open Time | Average days a ticket remains open |
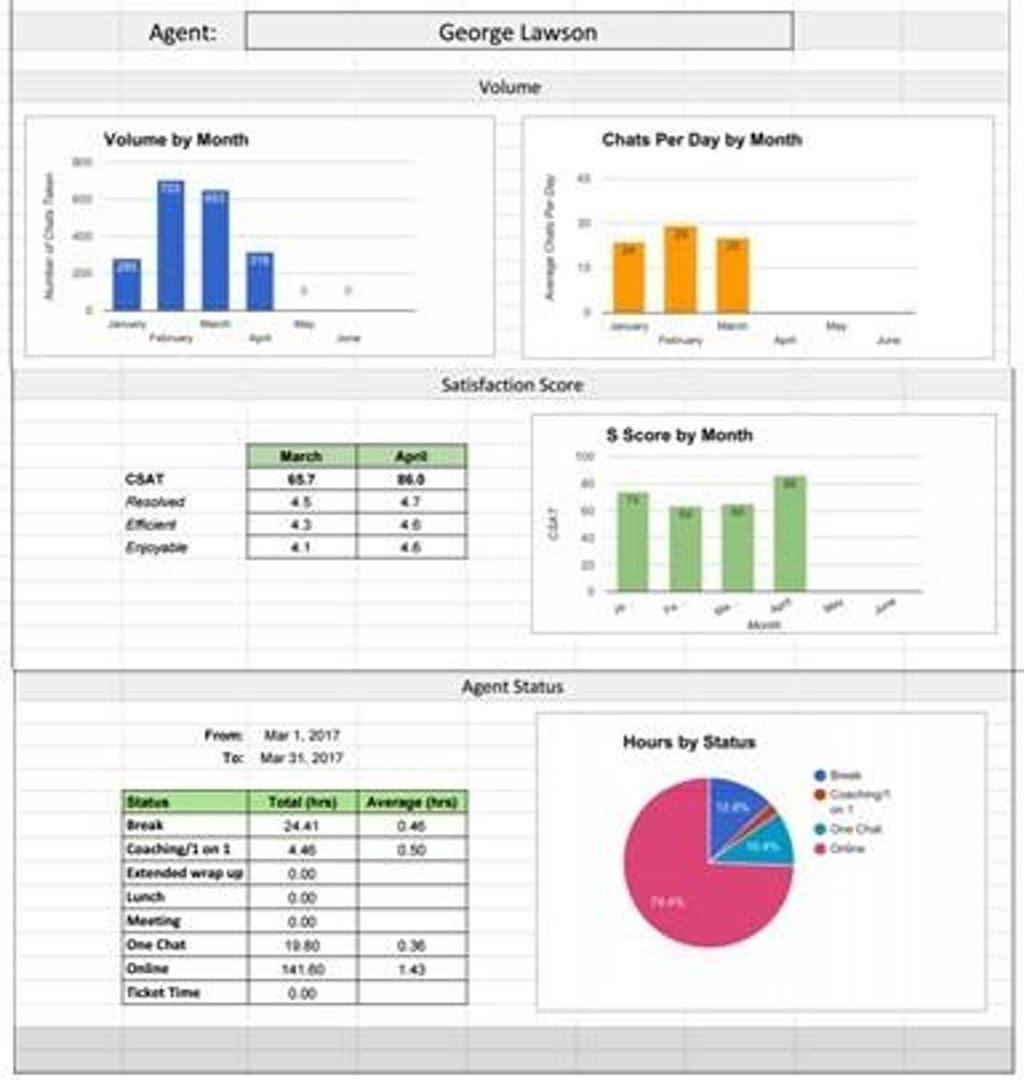
Why these matter: Agent-level metrics create accountability and identify top performers. They also flag agents who may need coaching or additional training. When agents see their own numbers improve, engagement increases.
Team-Level Metrics
A typical team leader manages 7–10 agents. These metrics help team leaders track collective performance and spot trends.
| Metric | Description |
|---|---|
| Chats per Hour | Chat volume per hour, broken down by agent |
| Handle Time for Team | Average chat duration across all agents and per agent |
| Utilization | Average percentage of time agents are online and active |
| Customer Satisfaction Score | Average score from post-chat surveys |
| Current Queue | Number of customers waiting for support |
| Highest Wait Time | Longest wait time in the current queue |
| Agents Available | Number of agents online and ready |
| Agents Away | Number of agents online but unavailable |
| New Tickets Created | Tickets opened that day |
| Tickets Still to be Closed | Open ticket backlog |
| Average Response Time | Time to first response on tickets |
| Average First Reply Time | Percentage of issues resolved on first contact |
| Chat Quality Score | Quality score from internal review |
| Agent Usage by Status | Time breakdown: online, meetings, coaching, breaks |
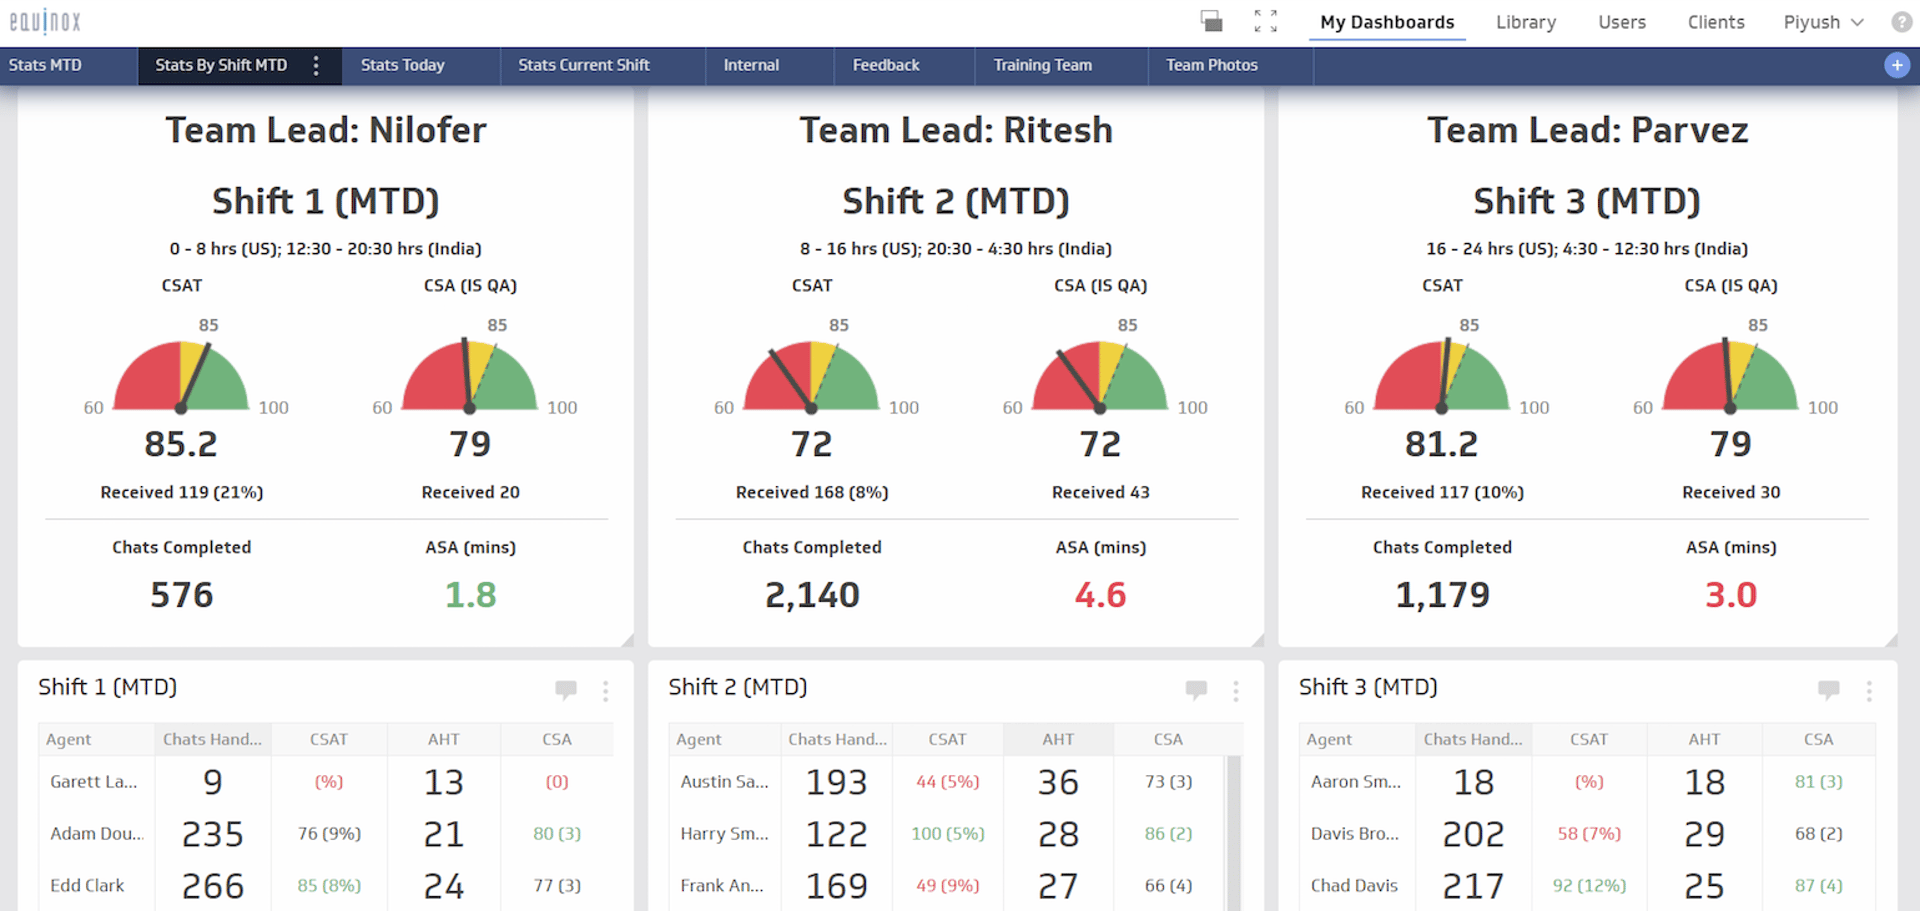
Why these matter: Team metrics let leaders spot bottlenecks (high queue depth, long wait times) and resource gaps (agents away, low utilization). They also reveal which agents need support and which are ready for promotion or mentoring roles.
Management-Level Metrics
Operations managers, directors of customer success, and VPs of customer success track these metrics weekly or monthly to oversee the entire support operation.
| Metric | Description |
|---|---|
| Chats Presented | Total chat volume by month, last 6 months |
| Average Speed of Answer | Average time to first response, by month, last 6 months |
| Customer Satisfaction Scores | Average CSAT by month, last 6 months |
| Handle Time for Team | Average chat duration across all agents, last 6 months |
| Cost per Chat | Total support department expense divided by chat count, by month, last 6 months |
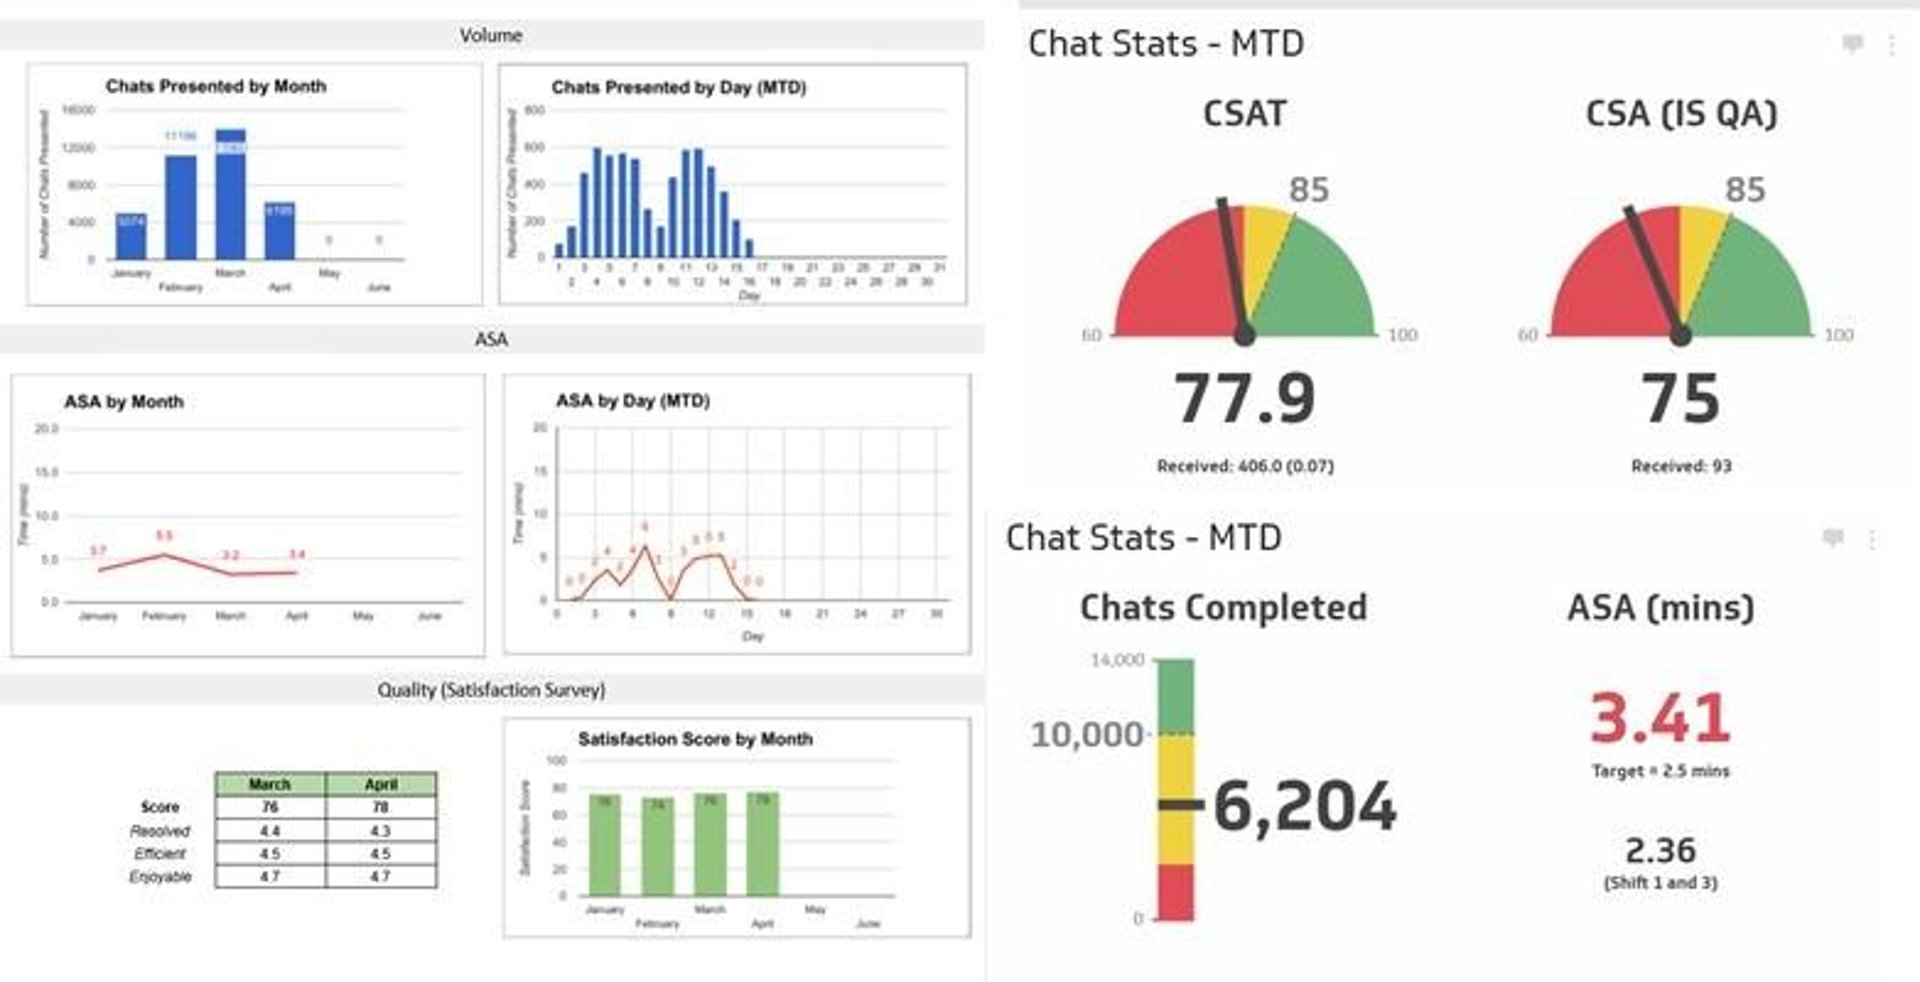
Why these matter: Management metrics show trends and patterns. They reveal whether support quality is improving or declining, whether staffing levels match demand, and whether you're spending efficiently. Cost per chat is especially valuable—it ties financial data to performance, showing resource efficiency.
Client-Level Metrics
Beyond operational metrics, track customer-specific data to identify at-risk clients and retention opportunities. Review these weekly:
- Which clients used chat more than three times this month?
- Which clients gave low satisfaction scores (detractors) three or more times in the last 60 days?
- Which clients gave high satisfaction scores (promoters) three or more times in the last 60 days?
- What questions did customers ask most frequently?
- What were the top five reasons customers sought support?
- What topics are trending month to month?
- Which clients use chat support most frequently?
- When did your team offer proactive support (outreach, check-ins)?
Action: Follow up personally with detractors to resolve issues. Thank promoters for their loyalty. Reach out to high-frequency users to ensure they're getting maximum value.
Business-Impact Metrics
Finally, track these metrics to inform decisions about support resources and strategy:
- Average lifetime value for chat-using clients: Are support customers worth more long-term?
- Average health score for chat-using clients: Are support customers healthier accounts overall?
These metrics connect support quality to revenue and retention, making the business case for support investment clear.
Building a Data-Driven Support Culture
Implementing these metrics takes time and commitment. But when you apply metrics to a problem or customer interaction, you get more thorough and effective solutions.
Start by sharing this list with your data team. Ask them to build a blueprint that includes:
- Which metrics to track
- How to extract them from your existing systems
- How often to refresh the data
- How to display results to each role (agent, team, manager, executive)
The blueprint transforms raw metrics into actionable dashboards. Use a tool like Klips to centralize data from your support platform (Zendesk, Salesforce Service Cloud, Intercom, etc.) and display it in real time.
The Path Forward
World-class SaaS support doesn't have to feel like a distant goal. With the right metrics in place, it becomes your company's baseline. Your team sees how their work drives satisfaction, retention, and revenue. Customers experience faster resolutions and proactive outreach. And your business makes smarter decisions about where to invest in support.
Start with agent-level metrics. Once those are in place, add team and management views. Then layer in client-level insights. Build incrementally, and you'll create a culture where data guides every support decision.
The metrics above give you the framework. The dashboards make the data visible. The commitment to improvement makes it real. That's how you deliver world-class support at scale.
Related Articles

5 tips to understand (and organize) your restaurant data
By Saleem Khatri — June 9th, 2026
6 dashboards I use daily to run my SaaS company
By Allan Wille, Co-Founder — April 10th, 2026
Business Metrics vs. KPIs: What’s the Difference?
By Jonathan Taylor — March 13th, 2026
