Hotel Dashboard
Track occupancy, ADR, and RevPAR to grow revenue and guest loyalty.
What is a Hotel Dashboard?
Hotel dashboards give hoteliers real-time insight into performance. They gather data from sources like your property management system, booking engines, and revenue tools. These dashboards display essential metrics such as occupancy rate, average daily rate (ADR), and revenue per available room (RevPAR), giving you a clear view of operations.
With their help, you can spot booking trends, find operational issues, and make decisions to improve your hotel’s operations and profitability. They also help you forecast demand spikes and potential cancellations so you can stay prepared.
Examples of Hotel Dashboards
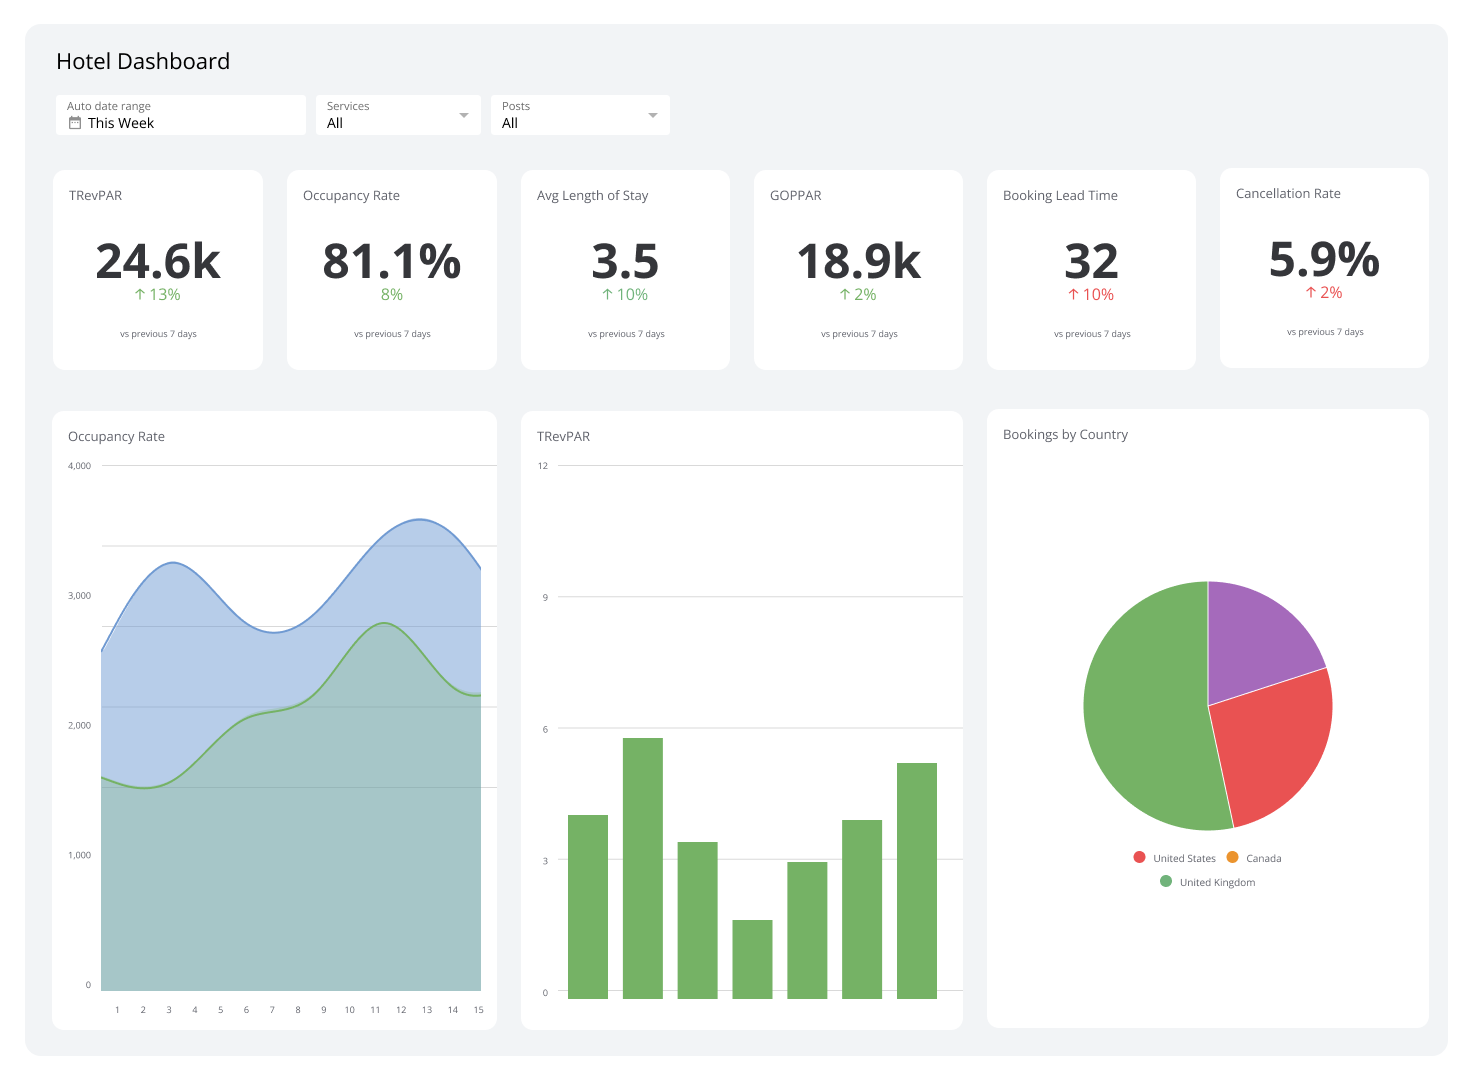
Hotel Performance Dashboard
Hotel performance dashboards provide an overview of financial and operational metrics that reflect the health of your hotel business. They display the figures behind room occupancy, average room rates, and total revenue, allowing you to quickly assess whether you’re meeting your targets.
These dashboards also track guest satisfaction scores and online review ratings so you can see reputation trends. This helps you address service gaps and adjust pricing to increase revenue and guest loyalty.
Who’s it for | Hotel general managers, revenue managers, operations managers, marketing directors, finance teams, property owners, corporate executives, asset managers, front desk managers, housekeeping managers |
How often it's needed | Real-time, daily, weekly, monthly, quarterly, annually |
Covered KPIs | Occupancy rate, RevPAR (revenue per available room), ADR (average daily rate), TRevPAR (total revenue per available room), GOPPAR (gross operating profit per available room), length of stay, booking lead time, channel mix, cancellation rate, guest satisfaction scores, review ratings, repeat guest percentage, cost per occupied room, labour cost percentage, energy consumption per occupied room, market share, competitive set performance, forecast accuracy, upsell conversion rate, ancillary revenue per guest, on-time check-in/check-out percentages, room turnover time, food and beverage revenue per guest |
Hotel Revenue Dashboard
A hotel revenue dashboard shows everything that contributes to total income, such as ADR, RevPAR, and revenue from rooms, food and beverage, and ancillary services.
This dashboard also helps you spot trends and opportunities to improve rates. For example, it can reveal if suite rates are underpriced compared to competitors.
Who’s it for | Revenue managers, general managers, sales directors, marketing managers, finance teams, property owners, corporate executives, asset managers, front office managers, reservation teams |
How often it's needed | Real-time, daily, weekly, monthly, quarterly |
Covered KPIs | ADR (average daily rate), occupancy rate, GOPPAR, revenue by market segment, revenue by channel, room nights sold, length of stay, booking lead time, cancellation rate, no-show rate, upsell and cross-sell revenue, food and beverage revenue, meeting and event revenue, spa and wellness revenue, parking revenue, revenue pace, pick-up, year-over-year growth, market penetration index, revenue forecast accuracy, price positioning vs. competitors, cost of customer acquisition, total revenue by day of week |
Guest Satisfaction Dashboard
Guest satisfaction dashboards give you a real-time look at sentiment by linking data from surveys, online reviews, and social media mentions. You’ll quickly see strengths and where service needs work. They also help you respond to complaints faster and recognize teams that are performing well.
Who’s it for | General managers, front office managers, guest relations managers, housekeeping managers, food and beverage managers, marketing teams, customer service representatives, department heads, quality assurance teams, executive leadership |
How often it's needed | Real-time, daily, weekly, monthly |
Covered KPIs | Overall guest satisfaction score, net promoter score (NPS), review ratings on OTAs and review sites, guest complaint rate, time to resolve complaints, guest survey response rate, cleanliness ratings, staff friendliness scores, check-in/check-out experience ratings, room comfort scores, Wi-Fi satisfaction, food and beverage quality ratings, value for money perception, loyalty program enrolment rate, repeat guest percentage, recommendation likelihood, social media sentiment analysis, in-stay feedback scores, post-stay survey results, amenity usage satisfaction, room service ratings, concierge service effectiveness, spa and wellness experience ratings, event and meeting planner satisfaction, brand standards compliance rate |
Channel Performance Dashboard
A channel performance dashboard tracks booking channels like online travel agencies (OTAs), direct bookings, and corporate accounts. It compares booking volume, ADR, and commission costs across channels.
You might find that while a partner brings volume, direct bookings through your site deliver higher margins. Use insights like this to shift spend and improve profitability.
Who’s it for | Revenue managers, distribution managers, e-commerce managers, marketing directors, general managers, sales teams, channel managers, OTA account managers, digital marketing specialists, executive leadership |
How often it's needed | Real-time, daily, weekly, monthly, quarterly |
Covered KPIs | Booking volume by channel, revenue by channel, channel contribution to total revenue, ADR by channel, cost per acquisition (CPA) by channel, commission costs by channel, net ADR by channel, conversion rates by channel, length of stay by channel, lead time by channel, cancellation rates by channel, channel mix percentage, year-over-year growth by channel, return on advertising spend (ROAS) by channel, mobile vs. desktop bookings by channel, loyalty program bookings by channel, direct booking percentage, metasearch performance, GDS performance, wholesaler performance, OTA market share, website traffic and conversion, parity compliance across channels, channel-specific promotions effectiveness, channel-specific customer lifetime value |
Hotel dashboards that make data easy
A hotel dashboard gives managers a clear view of overall performance. It brings revenue, guest sentiment, and booking source metrics together so teams can assess results and make informed decisions fast.
Klips dashboards make hotel data easier to work with. Start a free Klips trial.
Related Dashboards
View all dashboards