Revenue Dashboard
Track the metrics that matter and drive predictable growth.
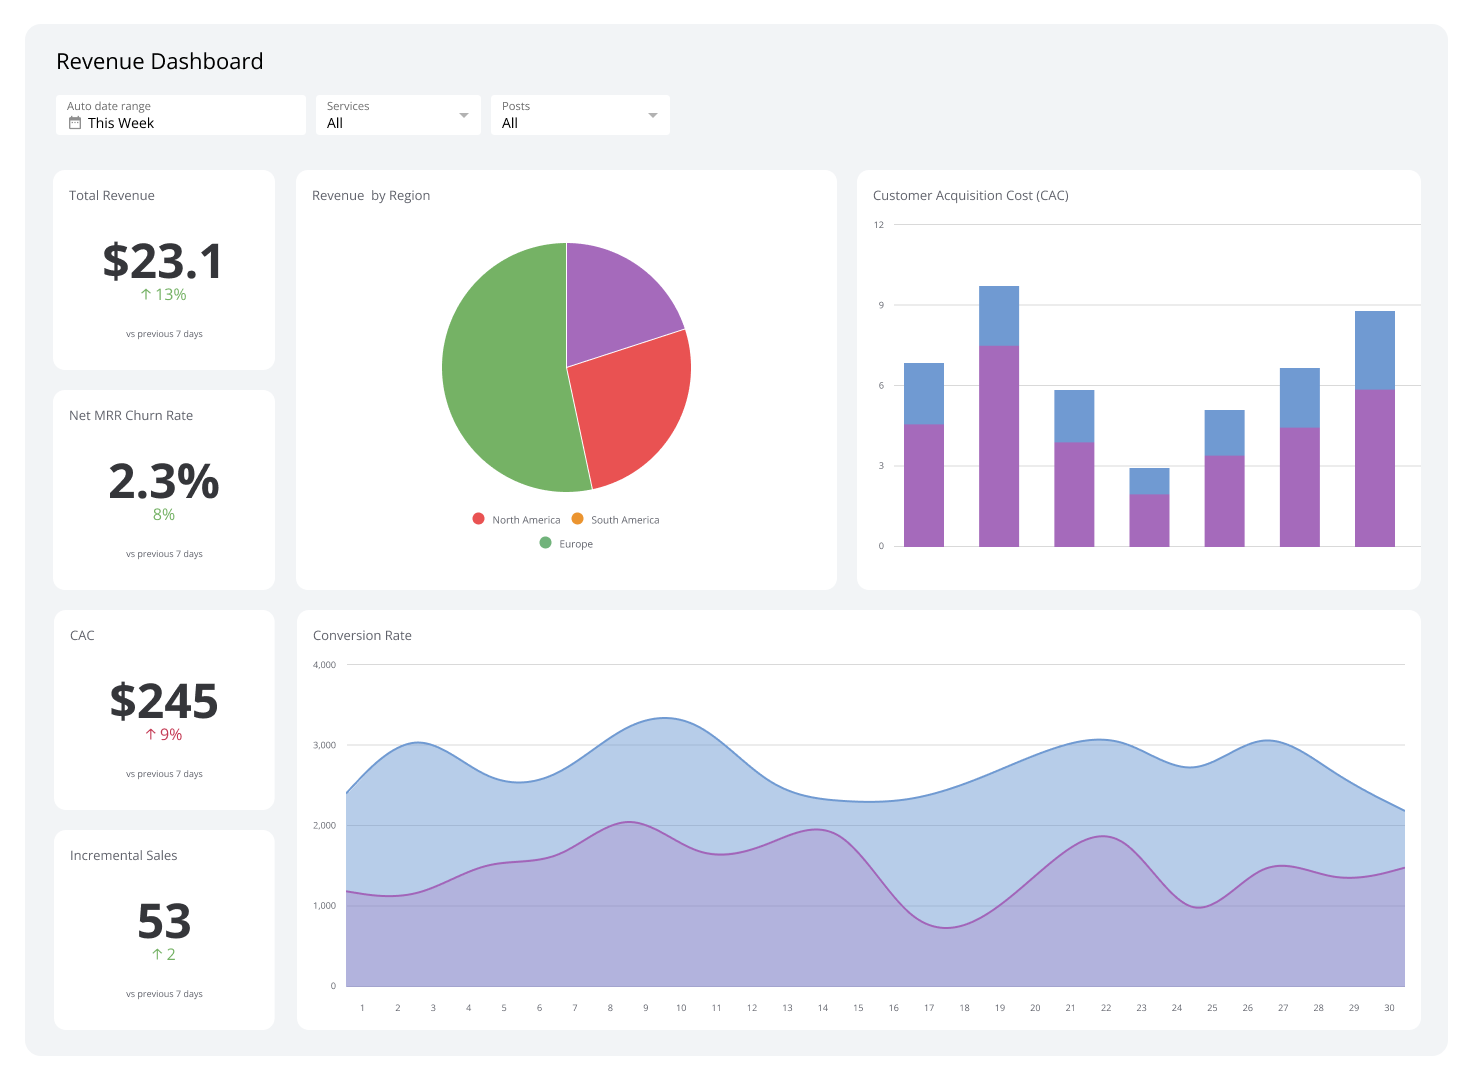
What is a revenue dashboard?
A revenue dashboard translates complex financial data into a clear, visual format that your entire team can act on.
For business leaders and managers, it's a command centre for monitoring key metrics like sales growth, customer acquisition cost (CAC), and profit margins. You can spot trends, identify opportunities, and make strategic decisions that drive sustainable growth — all from a single, trusted source.
Examples of revenue dashboards
The dashboards below cover the full range of revenue tracking needs, from high-level pipeline views to granular rep-level activity. Each one is designed to answer a specific business question.
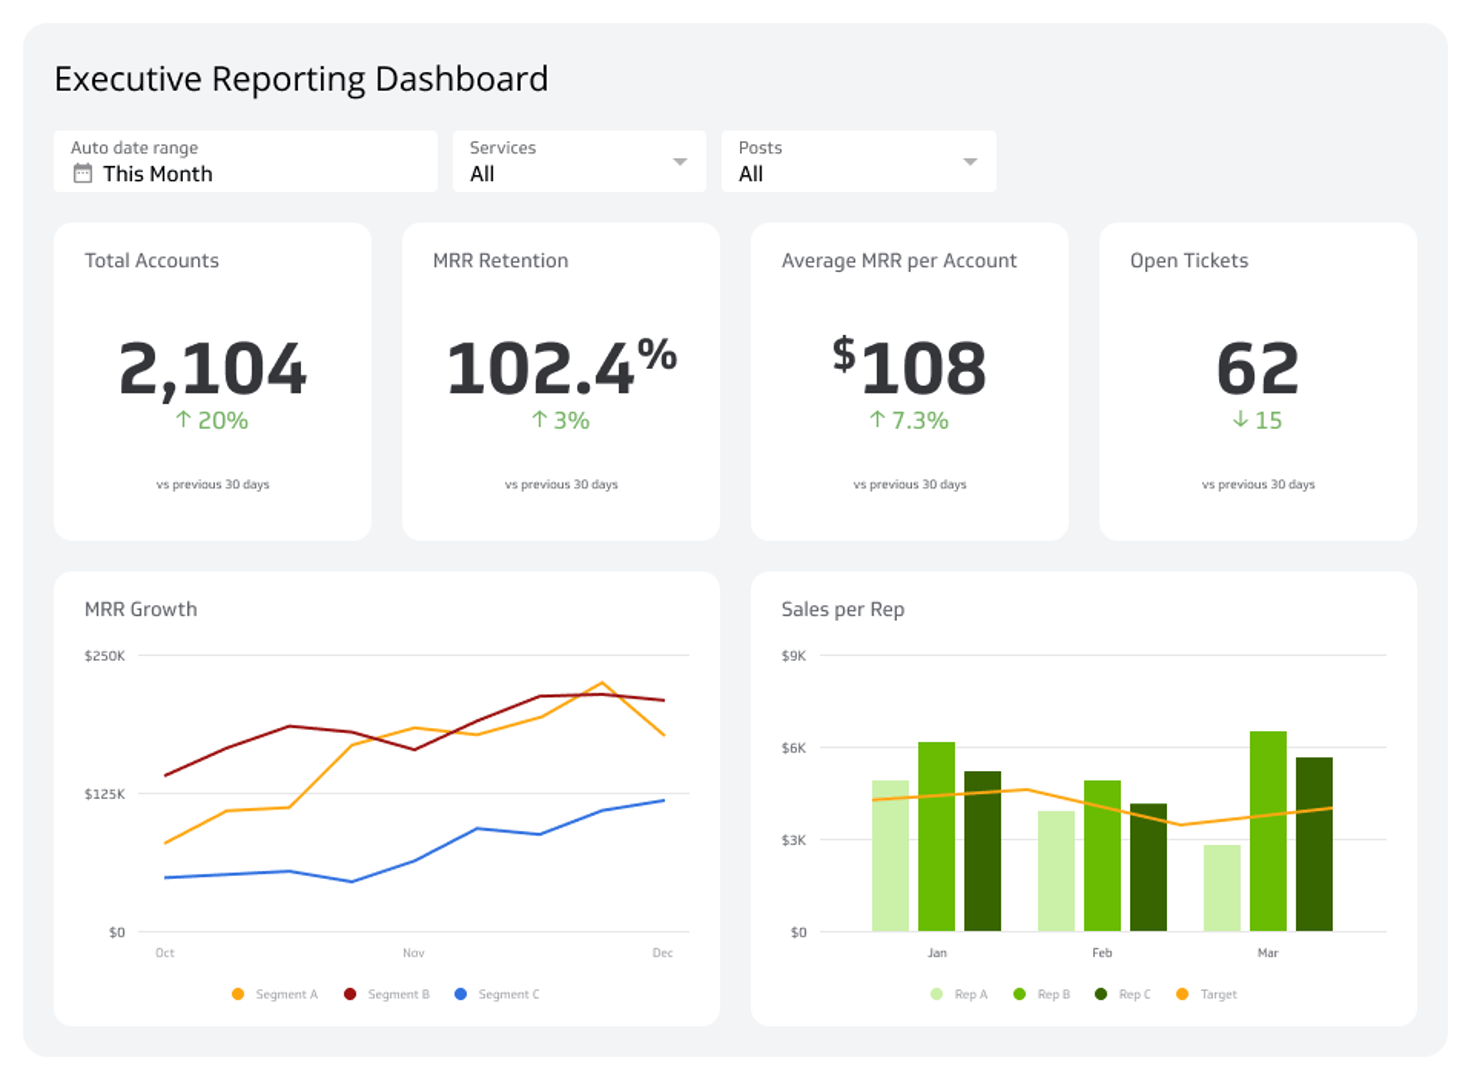
Sales Performance Dashboard
A sales performance dashboard gives managers a complete, real-time view of their team's momentum. Use it to track progress against revenue targets and understand the entire sales funnel at a glance.
| Who it's for | Sales managers |
|---|---|
| How often it's needed | Daily for real-time decisions; weekly for longer-term trends |
| Covered KPIs | Sales, ARPU, revenue evolution, customer acquisition costs (CAC), CLV |
Sales Manager Dashboard
This dashboard focuses on team output, giving managers clear insight into each member's performance. It helps establish benchmarks for average sale value and track progress toward team goals, with real-time conversion rates to support timely coaching decisions.
| Who it's for | Sales managers |
|---|---|
| How often it's needed | Daily to weekly |
| Covered KPIs | Sales per rep, conversion rate, revenue per employee |
Sales Engagement Dashboard
A sales engagement dashboard monitors customer interactions, conversion success, and outbound campaign metrics. It helps sales teams analyze the effectiveness of their outreach efforts and make data-driven choices that improve performance.
| Who it's for | Sales teams, sales leaders |
|---|---|
| How often it's needed | Daily to weekly |
| Covered KPIs | Sent emails, click-to-open rate, top representatives per open rate, lead won rate, new leads, lead drivers |
Sales Leaderboard
Tracking your team's sales manually is time-consuming and error-prone. A sales leaderboard automates this by compiling all relevant performance data in one place. It promotes healthy competition and helps you quickly identify top performers and those who may need support.
| Who it's for | Sales managers, sales representatives |
|---|---|
| How often it's needed | Hourly, daily, weekly, monthly |
| Covered KPIs | New customers, demos, new monthly recurring revenue (MRR), newly-acquired accounts, retention rate, onboarding calls per sales representative |
Conversion Dashboard
A conversion dashboard provides a granular look at each stage of your sales cycle. It surfaces key funnel metrics like the lead-to-opportunity ratio and the opportunity-to-win ratio, so you can pinpoint which parts of your sales process are working and which need attention.
| Who it's for | Sales managers |
|---|---|
| How often it's needed | Weekly to monthly |
| Covered KPIs | Lead-to-opportunity ratio, opportunity-to-win ratio, lead conversion rate |
Sales Productivity Dashboard
Executives need a high-level view of the company's sales pipeline. A sales productivity dashboard lets you zoom in on strategic areas to drive revenue and sharpen your sales approach, helping you identify where to focus for maximum impact.
| Who it's for | Sales executives |
|---|---|
| How often it's needed | Weekly to monthly |
| Covered KPIs | Top representatives, closed income by region, regional quota percentages, pipeline by region |
Win-Loss Dashboard
Win rates for individuals and teams shift constantly. A win-loss dashboard tracks those changes over time, making it easy to spot performance trends and develop targeted plans to increase wins and reduce losses.
| Who it's for | Sales teams |
|---|---|
| How often it's needed | Monthly |
| Covered KPIs | Opportunities gained and lost, win rate, loss rate |
Sales Activities Dashboard
A sales activities dashboard lets you monitor your team's outreach efforts in detail. It displays the number of calls made, call duration, and marketing emails sent, making it straightforward to evaluate which outreach strategies are delivering results.
| Who it's for | Sales teams, sales managers |
|---|---|
| How often it's needed | Weekly to monthly |
| Covered KPIs | Funnel conversion rate, income per day, dials per hour |
Sales Cycle Length Dashboard
An efficient sales cycle is critical to business success. A sales cycle length dashboard helps managers understand the average time it takes to close a deal, supporting decisions that improve overall team productivity.
| Who it's for | Sales managers |
|---|---|
| How often it's needed | Monthly |
| Covered KPIs | Lead conversion rate, average sales cycle length |
Time-Tracking Dashboard
A time-tracking dashboard gives sales managers a detailed breakdown of how each team member allocates their time. Productivity bottlenecks become visible quickly, so you can address them before they affect results.
| Who it's for | Sales managers |
|---|---|
| How often it's needed | Daily |
| Covered KPIs | Total hours tracked, billable hours, clients, tasks, time spent per project |
MRR Breakdown Dashboard
An MRR breakdown dashboard separates your monthly recurring revenue into its core components: new MRR, expansion MRR, and churn. This breakdown reveals the dynamics affecting your income, so you can make calculated choices that support growth and stability.
| Who it's for | Sales teams, sales managers |
|---|---|
| How often it's needed | Monthly |
| Covered KPIs | Net monthly recurring revenue, net MRR churn rate, MRR expansion rate, lost MRR from cancellations |
Sales Opportunity Dashboard
This dashboard highlights future growth opportunities in your sales pipeline and points you toward the most promising leads. It organizes business opportunities by stage, region, and average purchase value using comprehensive sales data.
| Who it's for | Sales managers |
|---|---|
| How often it's needed | Weekly to monthly |
| Covered KPIs | Bookings, sales opportunities, average value per purchase, regional opportunity breakdown, units per transaction |
Deal Performance Dashboard
A deal performance dashboard provides a comprehensive view of your sales pipeline and deal progress. It tracks when deals are approaching close, monitors pipeline changes, and surfaces expected closure dates to keep your team focused on what matters most.
| Who it's for | Sales teams |
|---|---|
| How often it's needed | Daily, weekly, monthly |
| Covered KPIs | Pipeline changes, newly-created deals, sales cycle length |
Sales-by-Region Dashboard
A sales-by-region dashboard shows how much revenue you're generating across different locations and product lines. It breaks down sales by individual reps and customers, helping you develop better strategies to grow income in key markets.
| Who it's for | Sales managers |
|---|---|
| How often it's needed | Daily, weekly, monthly |
| Covered KPIs | Product sales, sales by city, sales by region, income by product group |
Sales Product Performance Dashboard
A sales product performance dashboard clearly visualizes the effectiveness of your products and campaigns. It highlights which products generate the most revenue and displays online versus in-store purchase figures.
| Who it's for | Sales teams |
|---|---|
| How often it's needed | Daily, weekly, monthly |
| Covered KPIs | Cost of goods sold (COGS), incremental sales, product performance |
Sales KPI Dashboard
A sales KPI dashboard visualizes essential metrics — such as customer churn rate and income per sales rep — to provide a clear performance overview. Compare actual sales figures against targets to evaluate individual performance and identify who may need additional support.
| Who it's for | Sales managers, executives |
|---|---|
| How often it's needed | Daily, weekly, monthly |
| Covered KPIs | Income per sales rep, upsell and cross-sell rates, profit margin per representative, customer churn rate |
Sales Pipeline Dashboard
A sales pipeline dashboard offers detailed insight into your pipeline, showing where leads originate and how they progress. Use this data to make the adjustments needed to meet quotas and capitalize on opportunities.
| Who it's for | Sales analysts, sales managers, executives |
|---|---|
| How often it's needed | Weekly to monthly |
| Covered KPIs | Sales quota attainment, pipeline by opportunity size, pipeline by opportunity stage |
Build your revenue dashboard with Klipfolio Klips
The dashboards above cover every layer of revenue performance, from individual rep activity to company-wide pipeline health. The right combination depends on your team's size, sales motion, and the questions you need answered most often.
Klipfolio Klips connects to 130+ data sources and gives you the flexibility to build custom dashboards that fit your exact reporting needs. No credit card required. Start your free trial today.
At a glance
Focus Area
Sales performance, pipeline management, MRR tracking, team productivity, and regional revenue analysis.
Metrics List
Sales volume, ARPU, CAC, CLV, MRR, win rate, conversion rate, sales cycle length, quota attainment, churn rate.
Reference Rate
Daily to monthly depending on dashboard type; most pipeline and KPI dashboards are reviewed weekly.
Related Dashboards
View all dashboards