Digital Marketing Dashboard
Reach your target audience by tracking top digital marketing metrics that measure your success.
What is a Digital Marketing Dashboard?
A digital marketing dashboard displays real-time visualizations of your online marketing KPIs, metrics, and campaign performance in one centralized view.
Marketing teams use digital marketing dashboards to monitor campaigns across channels — including social media, email, paid advertising, SEO, and lead generation — and make faster, more informed decisions.
How do you create a digital marketing dashboard?
Before you build, align with your team on what success looks like. The right dashboard reflects your goals, your audience, and the data sources available to you.
Consult with your marketing team to understand reporting needs and priorities
Define your KPIs and metrics based on the channels and campaigns you're running
Select your marketing dashboard software with the connectivity and customization your team needs
Connect to data sources such as Google Analytics 4, your ad platforms, and your CRM
Create data visualizations that make trends and performance gaps easy to spot
Deploy and get feedback so you can refine the dashboard over time
What should you put on a digital marketing dashboard?
The goal of a digital marketing dashboard is to give your team a clear, graphical view of marketing performance. That could mean a focused view of one channel — like social media or digital advertising — or a broader executive summary of demand generation and pipeline contribution.
Consult with your marketing team to determine which marketing metrics and KPIs belong on your dashboard. Below are four visualizations commonly included in digital marketing dashboards.
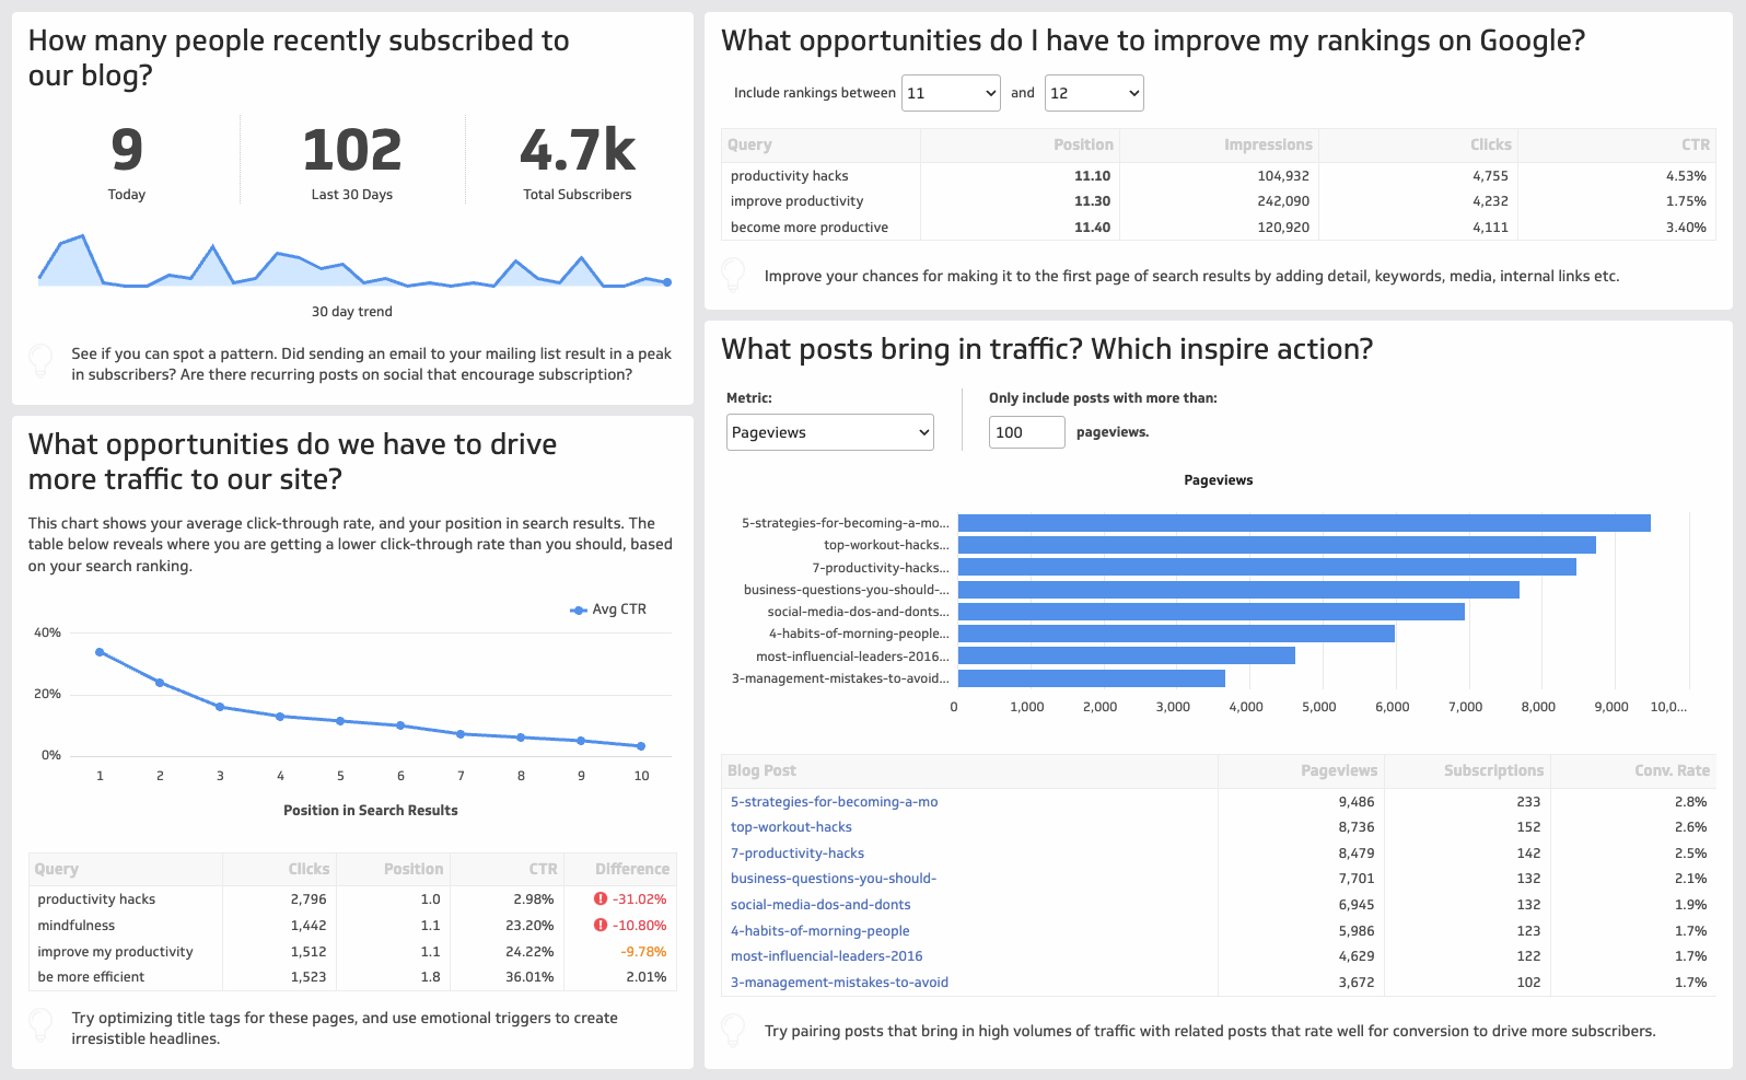
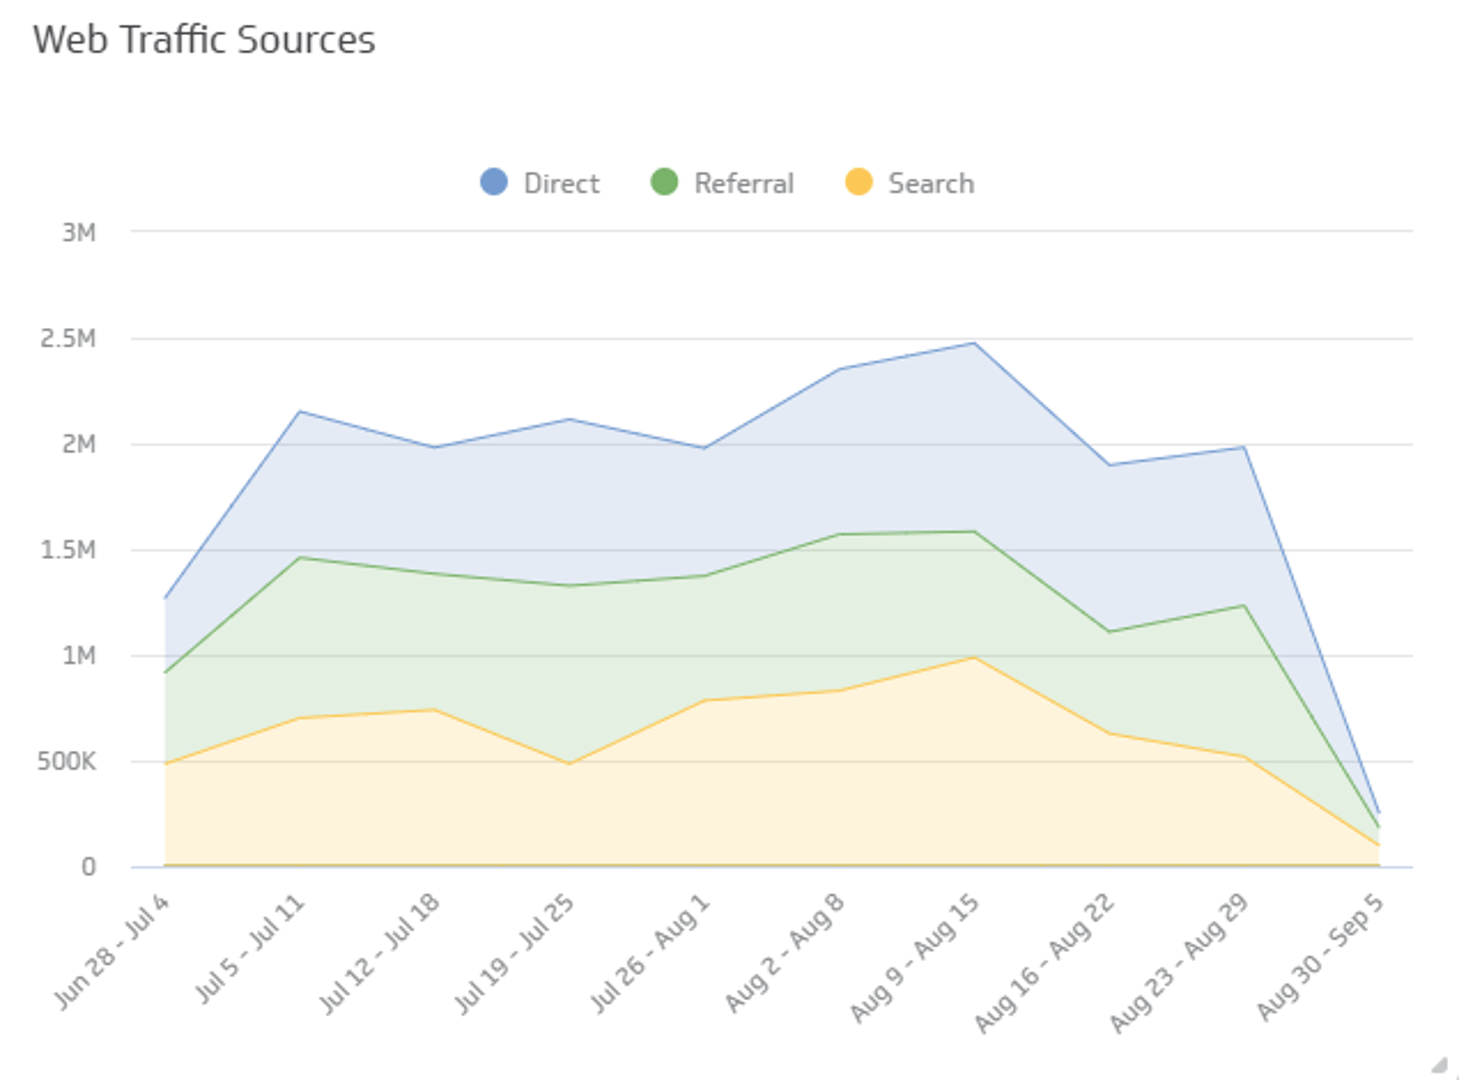
Web traffic sources
Digital marketers need to know which online channels drive traffic to their websites. Tracking traffic by source — organic, paid, referral, direct, and social — lets you spot shifts early and set realistic growth targets.
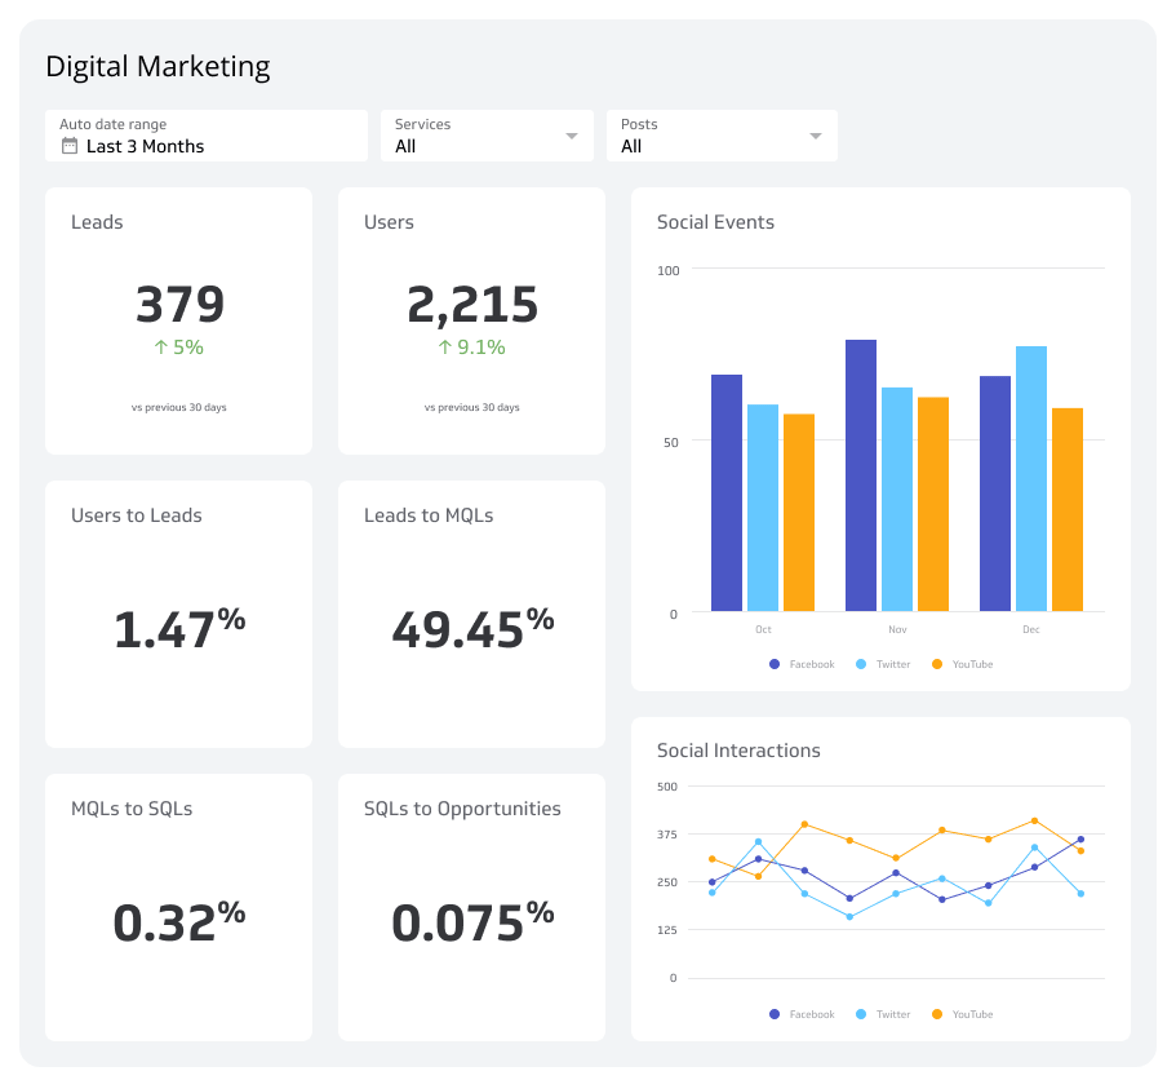
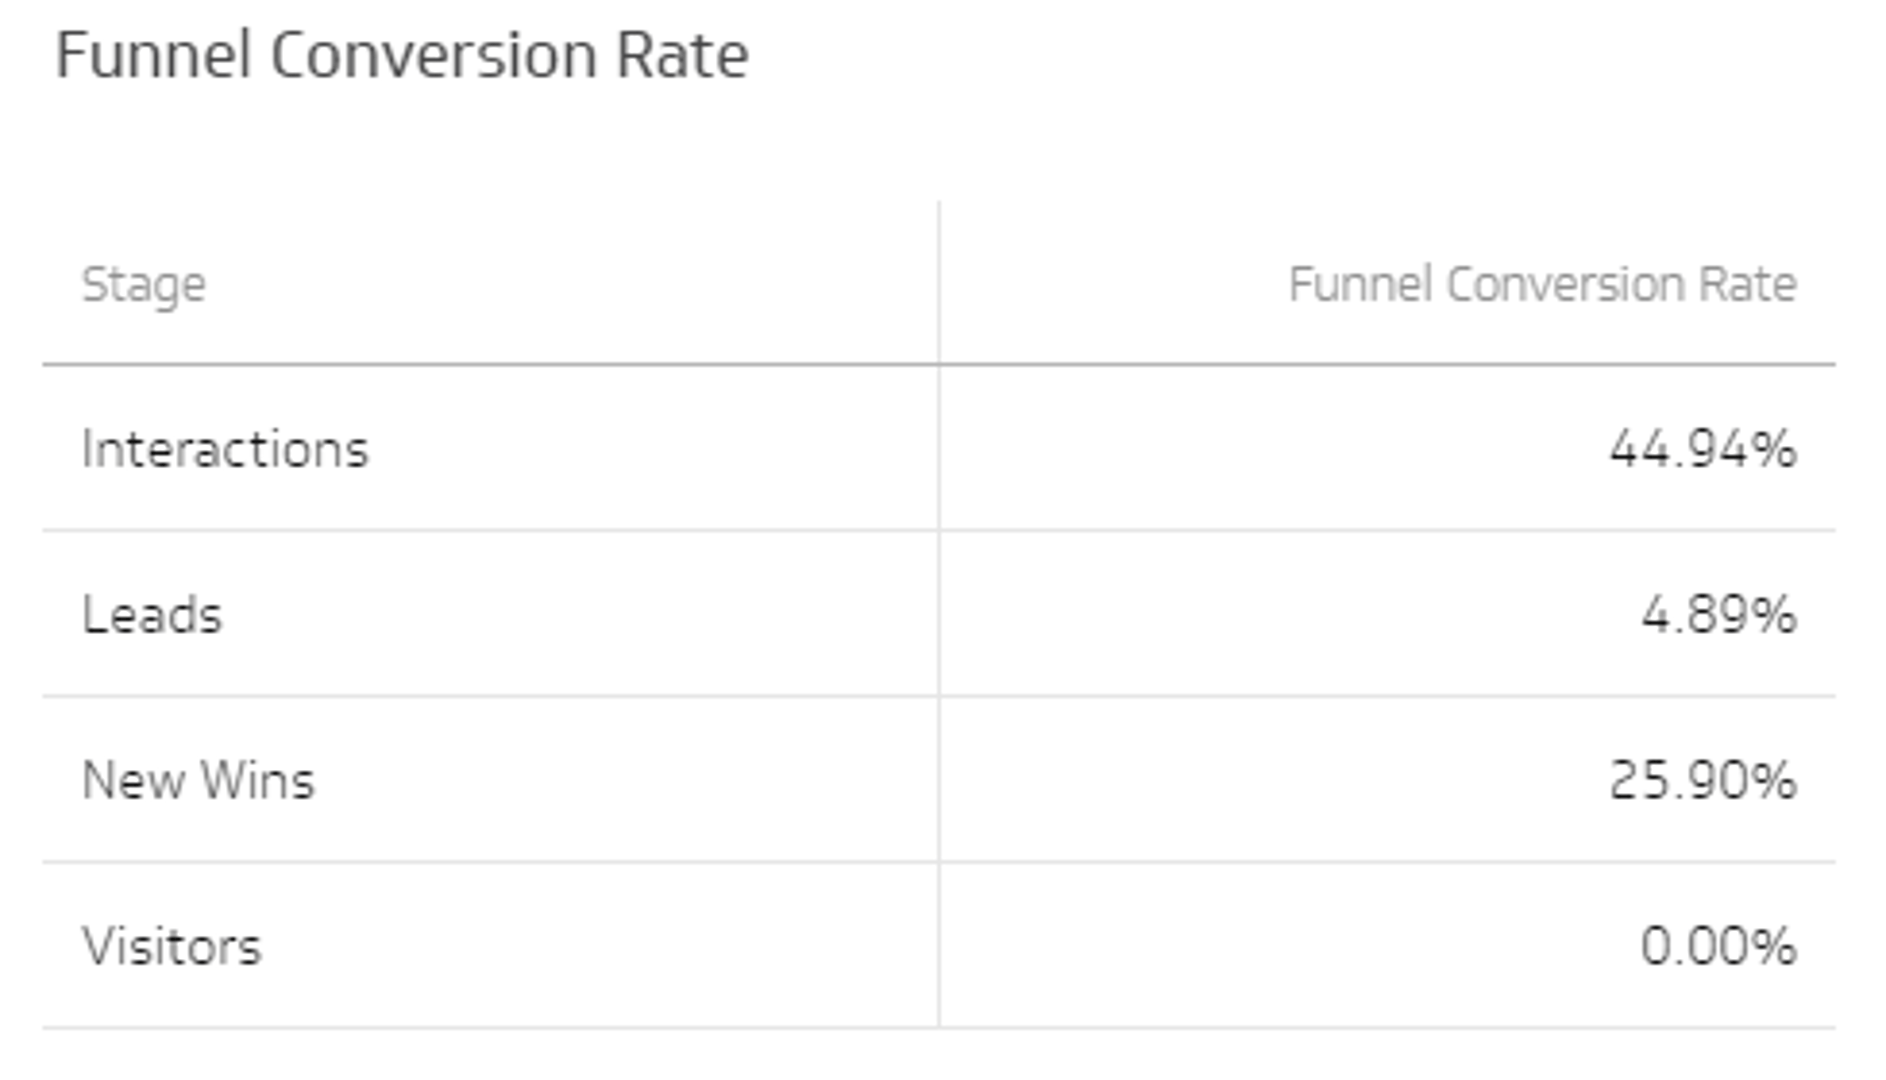
Funnel conversion rate
The marketing funnel measures your ability to move web visitors and leads through to opportunities and customers. Include this visualization to show how effectively your programs convert at each stage.
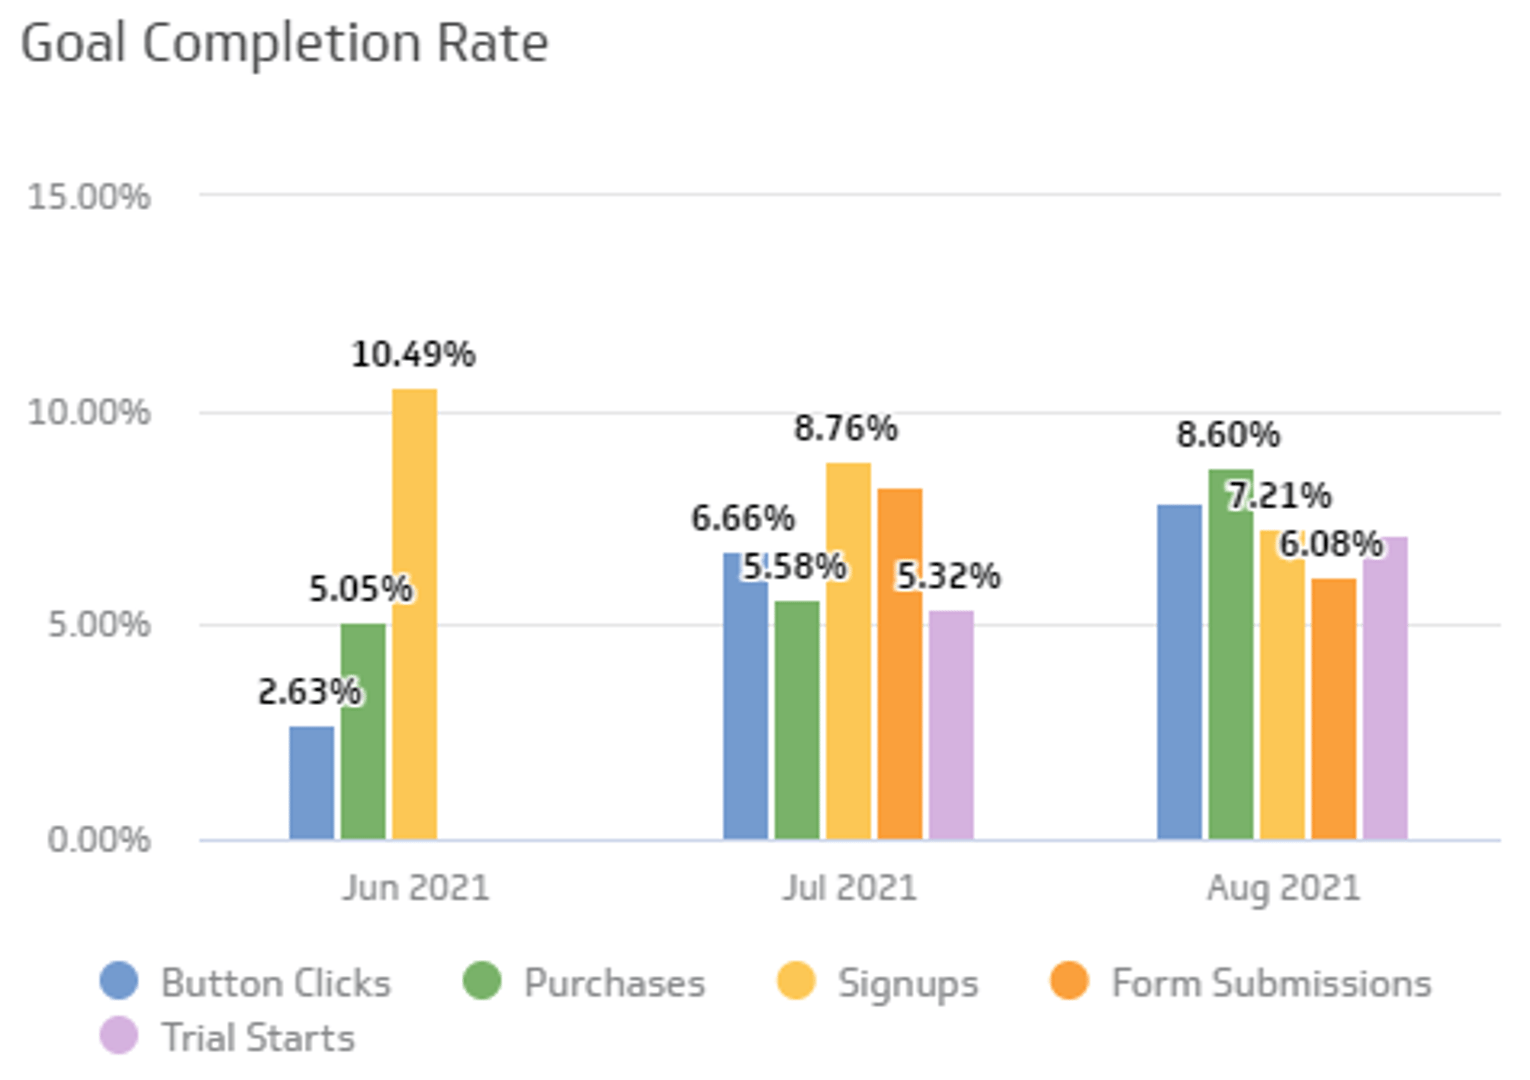
Goal completion rate
Your website is likely your most effective lead generation channel. Tracking goal completion rate — segmented by channel, device, or demographic — gives you the data you need to run meaningful conversion rate experiments.
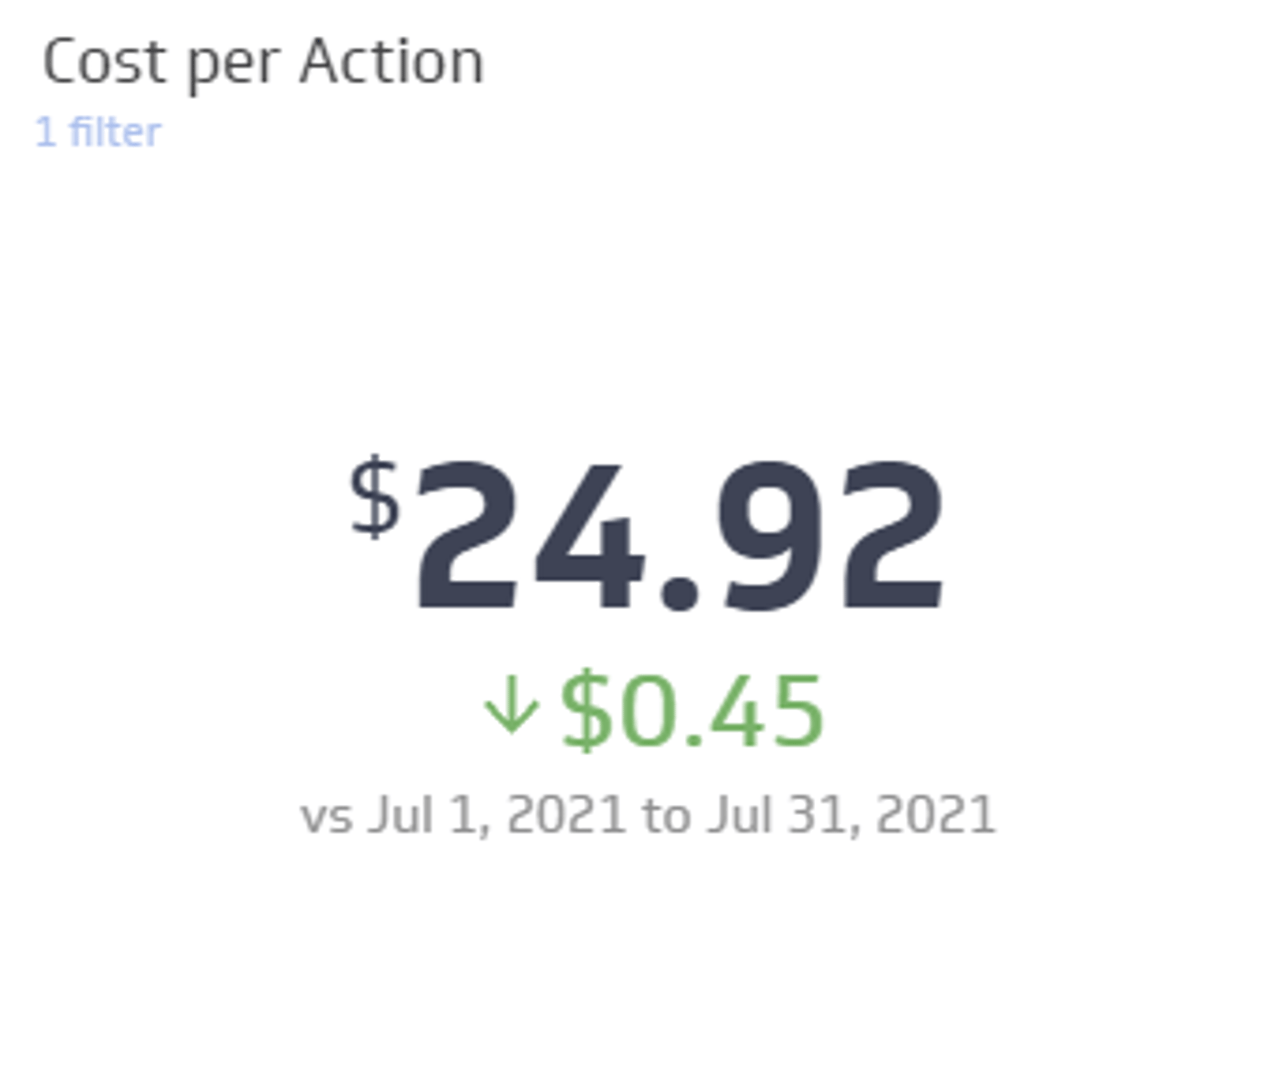
Cost per action
Paid advertising is a core channel for growth, and cost per action (CPA) is the metric that tells you whether your spend is working. Each advertising platform surfaces its own variation of CPA — track it across platforms to compare efficiency and guide budget decisions.
Key metrics for your digital marketing dashboard
A well-built digital marketing dashboard surfaces the metrics that connect marketing activity to business outcomes. The right mix depends on your channels and goals, but most marketing teams track a combination of the following.
Acquisition and traffic:
Page views and sessions
Users and new users
Web traffic by source (organic, paid, referral, direct, social)
Bounce rate and average session duration
Lead generation and pipeline:
Leads
Marketing Qualified Leads (MQLs)
Sales Qualified Leads (SQLs)
Opportunities and won customers
Campaign and conversion performance:
Goal completion rate
Funnel conversion rate
Click-through rate (CTR)
Cost per click (CPC)
Cost per action (CPA)
Return on Ad Spend (ROAS)
Build your digital marketing dashboard with Klips
Use marketing dashboards to track the performance of your online marketing activities and monitor in real time how your campaigns contribute to the sales funnel.
Klips connects to 130+ data sources — including Google Analytics 4, Google Ads, Meta, LinkedIn, HubSpot, and more — so you can pull all your marketing data into one place. From there, you can build custom visualizations, set up automated refreshes, and distribute dashboards to your team, executives, or clients.
Ready to see what your marketing data looks like in one view? Explore Klips dashboard templates or build your own from scratch.
At a glance
Focus Area
Digital marketing performance monitoring across paid, organic, social, email, and lead generation channels.
Metrics List
Web traffic sources, funnel conversion rate, goal completion rate, cost per action, MQLs, SQLs, CTR, CPC, ROAS.
Reference Rate
Real-time to daily refresh depending on campaign cadence and data source availability.
Related Dashboards
View all dashboards