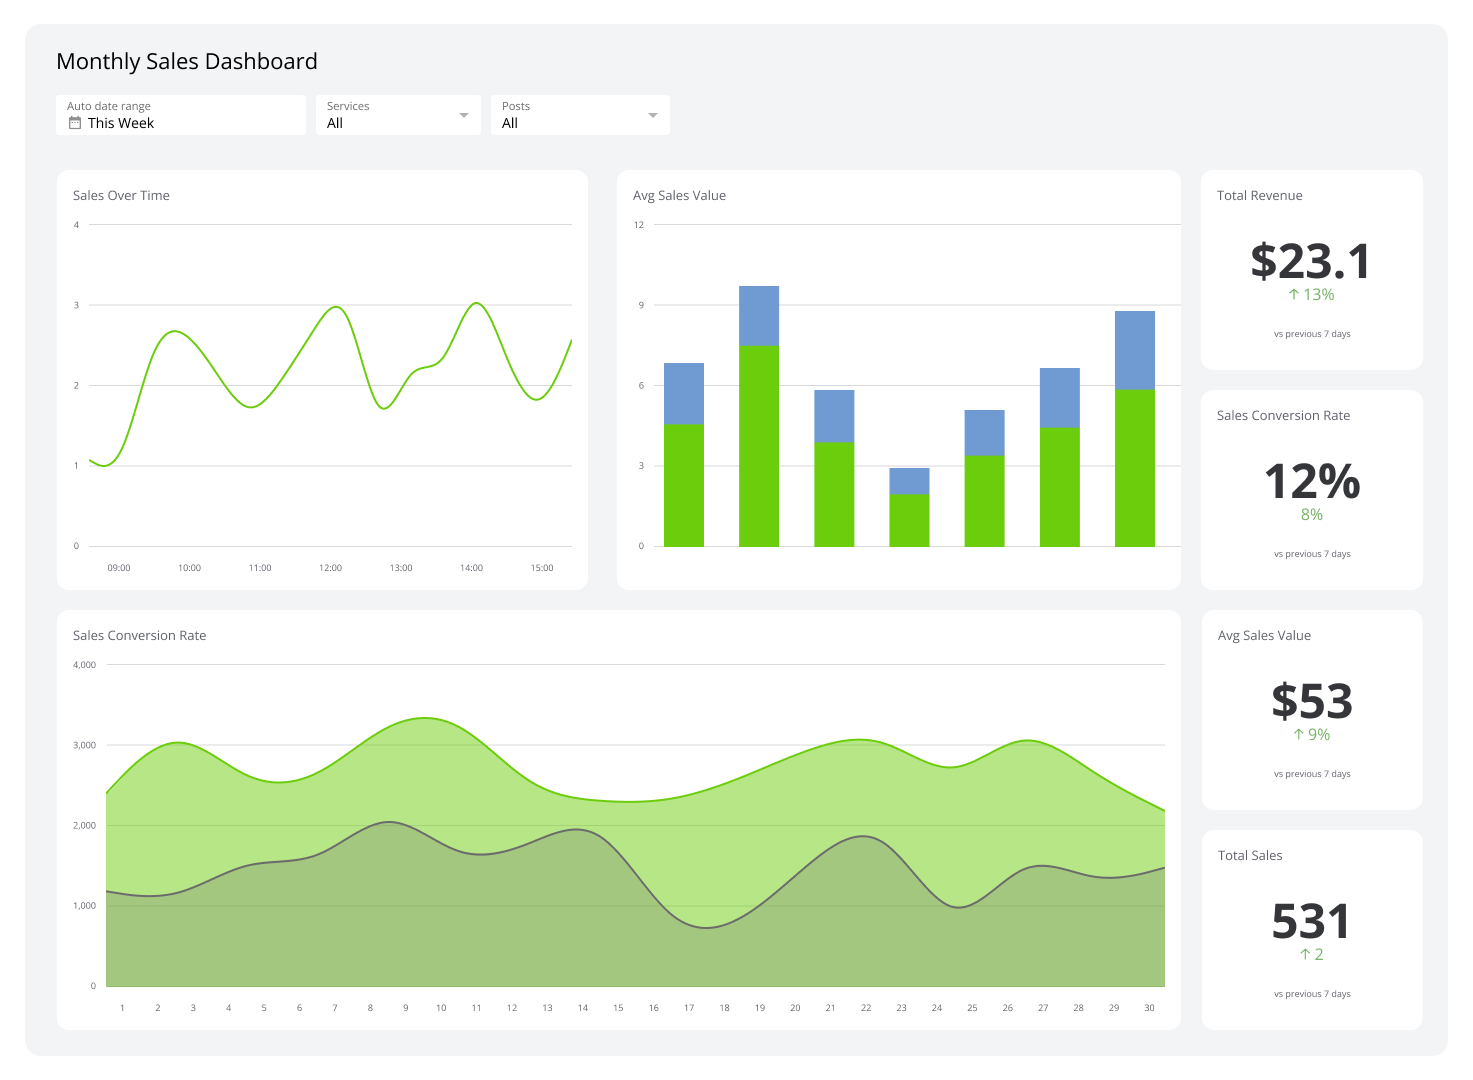
Monthly Sales Dashboard
Track MRR, new accounts, and daily sales in real-time.
What is a Monthly Sales Dashboard?
A monthly sales dashboard gives your entire team a real-time, transparent view of progress toward sales targets — no manual updates required.
When your sales team can see business targets and current performance in one place, it creates alignment across the department. The team no longer has to rely on weekly status reports pulled from an Excel sheet that needs constant updating.
This sales dashboard tracks KPIs reported on a monthly cadence, including metrics like sales today, new accounts this month, and MRR this month. Dashboards turn raw data into clear visualizations that help teams understand their progress and spot where they're falling short.
A monthly sales dashboard is a strong fit for teams that:
Want to track sales performance in real-time rather than waiting for end-of-month reports
Have business targets and goals to report on and need a clear view of progress
Want to make data-driven decisions without digging through spreadsheets
Are ready to move beyond Excel for tracking sales metrics and KPIs
How to build a monthly sales dashboard
You can build a monthly sales dashboard using data from your CRM, charted against your business targets. Here's how:
- Create a CRM report that tracks the sales KPIs you report on each month.
- Define your monthly targets for each KPI you want to monitor — a spreadsheet works fine for this step.
- Build data visualizations that compare monthly performance against those targets.
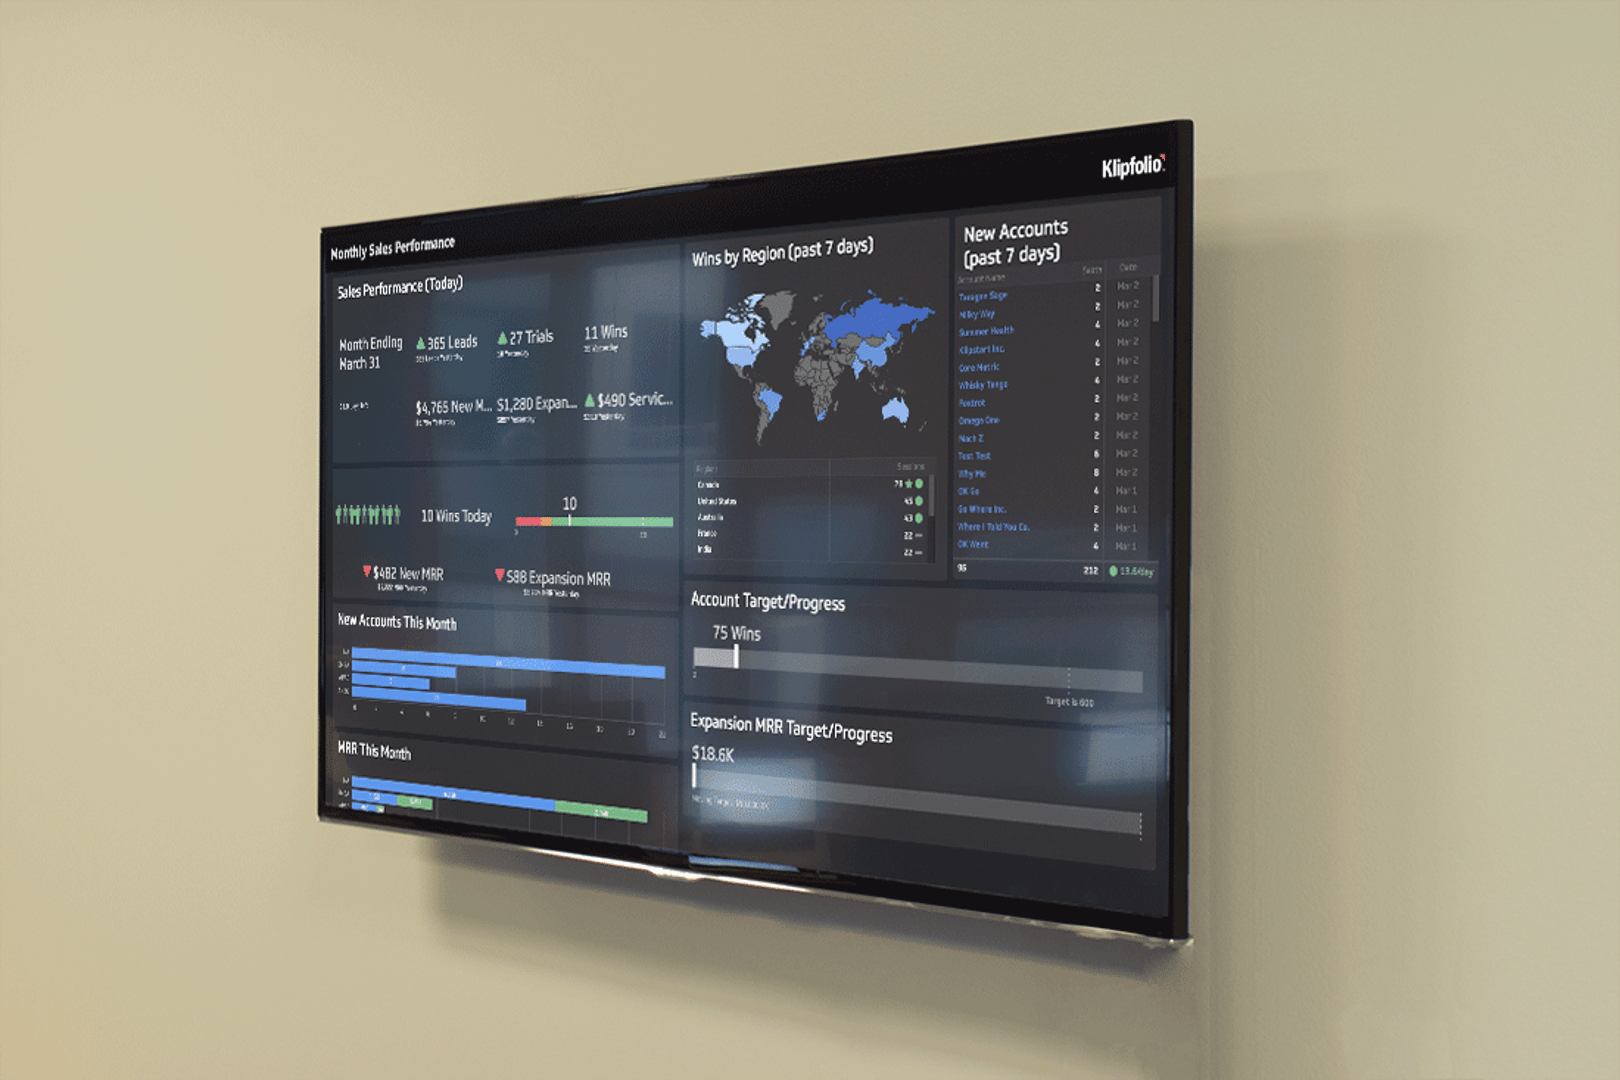
- Distribute the dashboard to your team via a TV monitor in the office, a shared link, or scheduled email reports so everyone stays aligned.
Key metrics to include
Your monthly sales dashboard should surface the numbers your team acts on. Common metrics include:
Sales today: Daily revenue to gauge momentum against monthly targets
New accounts this month: New customer acquisition tracked in real-time
MRR this month: MRR monthly recurring revenue to monitor subscription growth
Expansion MRR: Revenue growth from existing accounts through upsells or cross-sells
MRR retention rate: How effectively your team is retaining expected monthly revenue
Sales by region: Geographic breakdown to identify top-performing markets
Examples of sales metrics to add to your dashboard
Since building a sales dashboard is tied closely to your CRM, here are a few examples of what you can build with Klips.
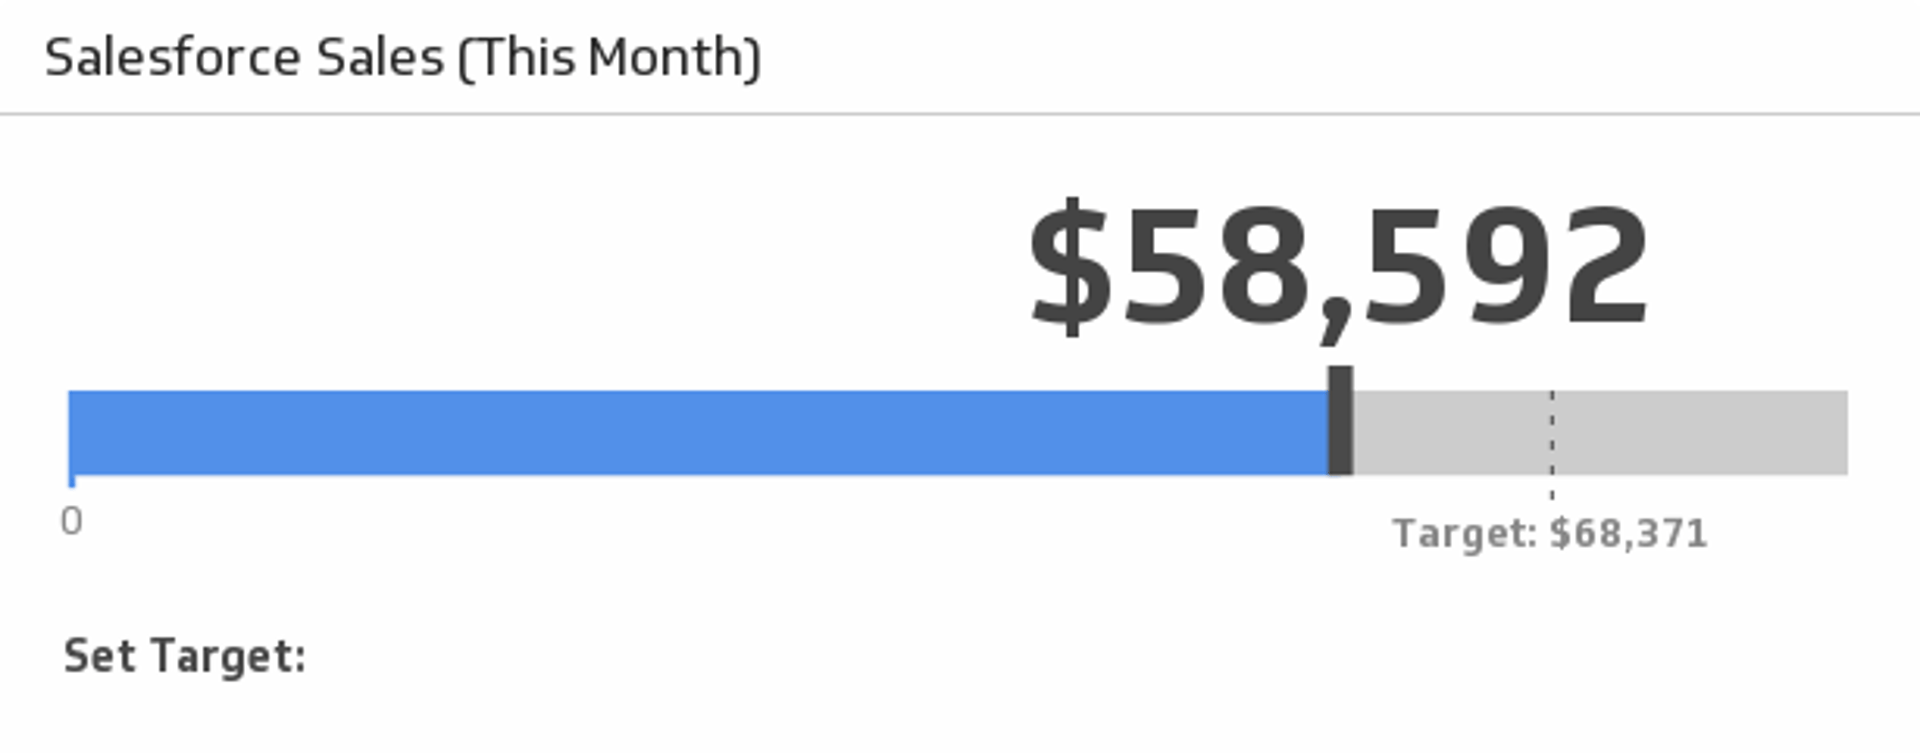
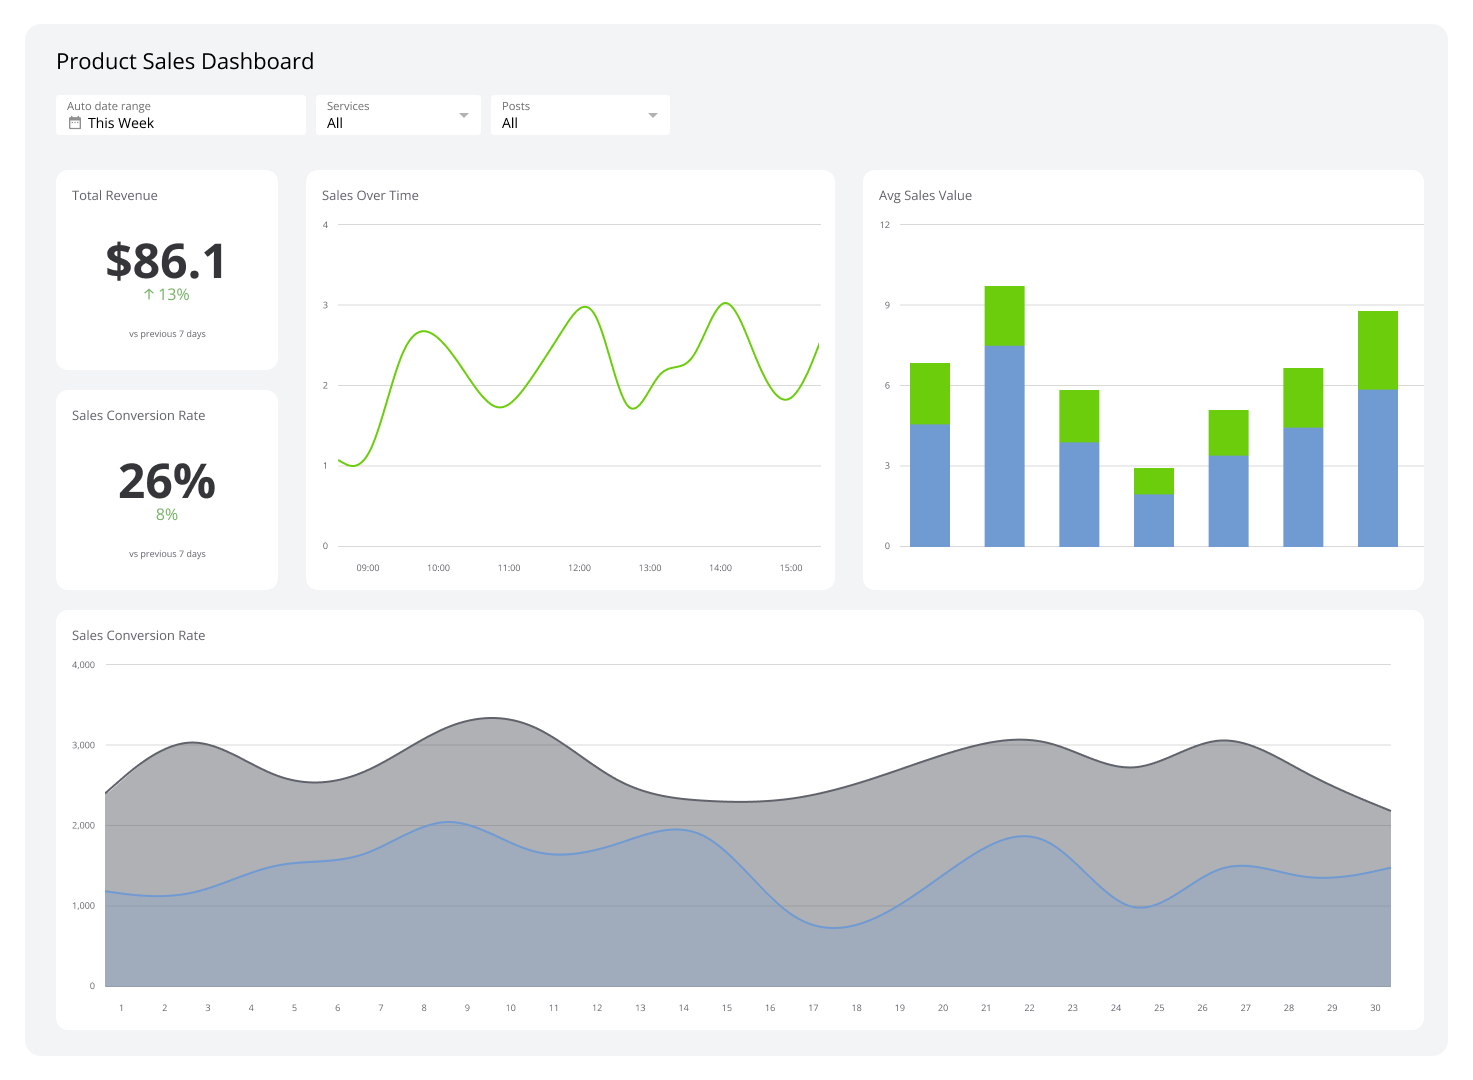
Sales this month
Monitor your sales this month and compare to the average of the last three months.
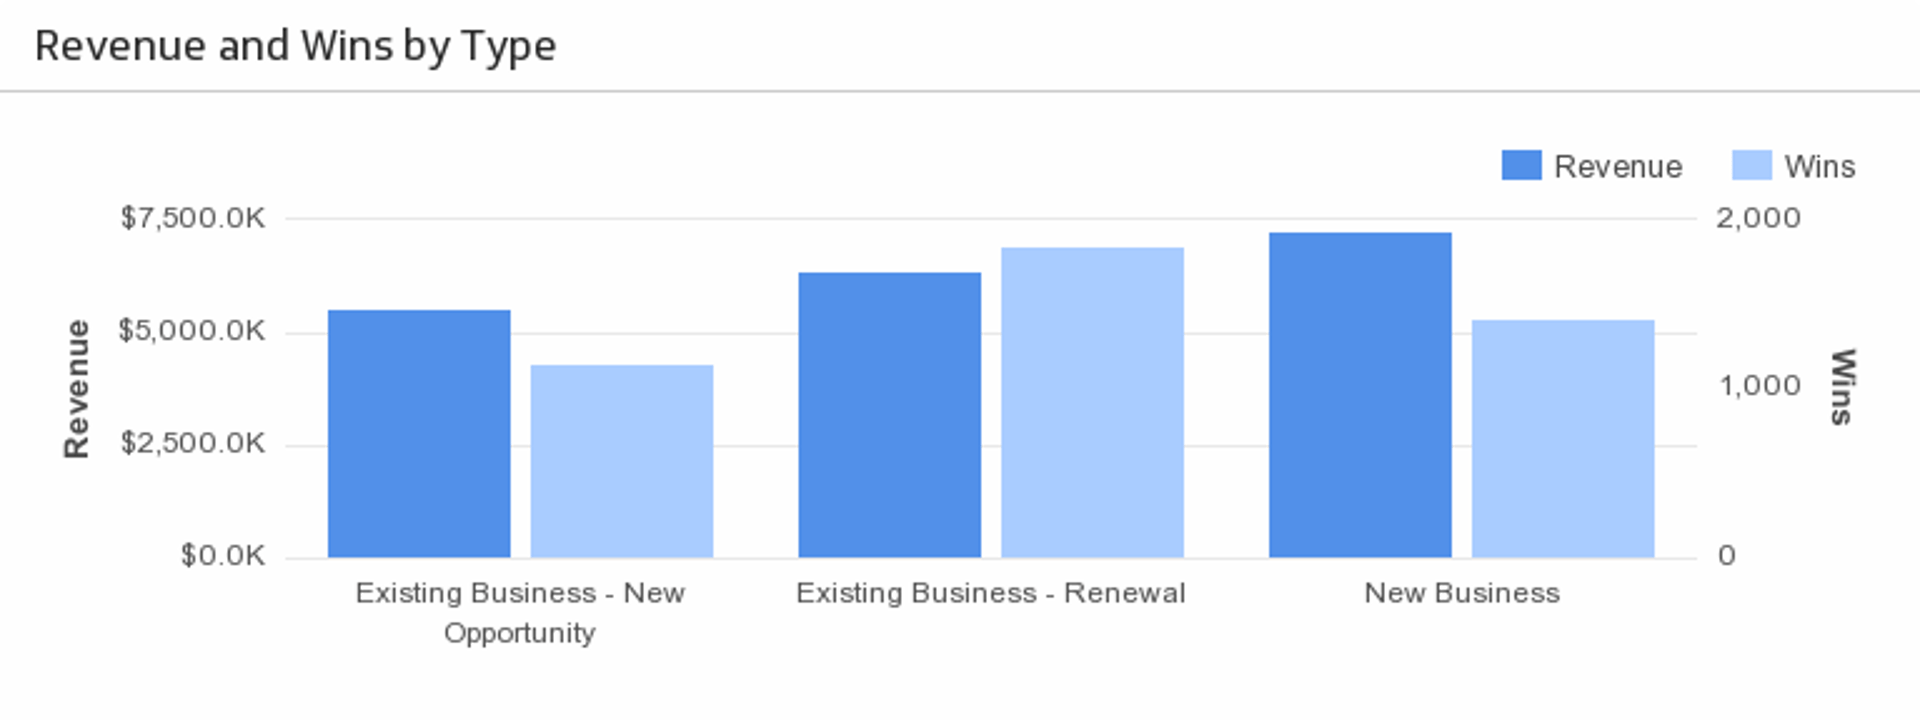
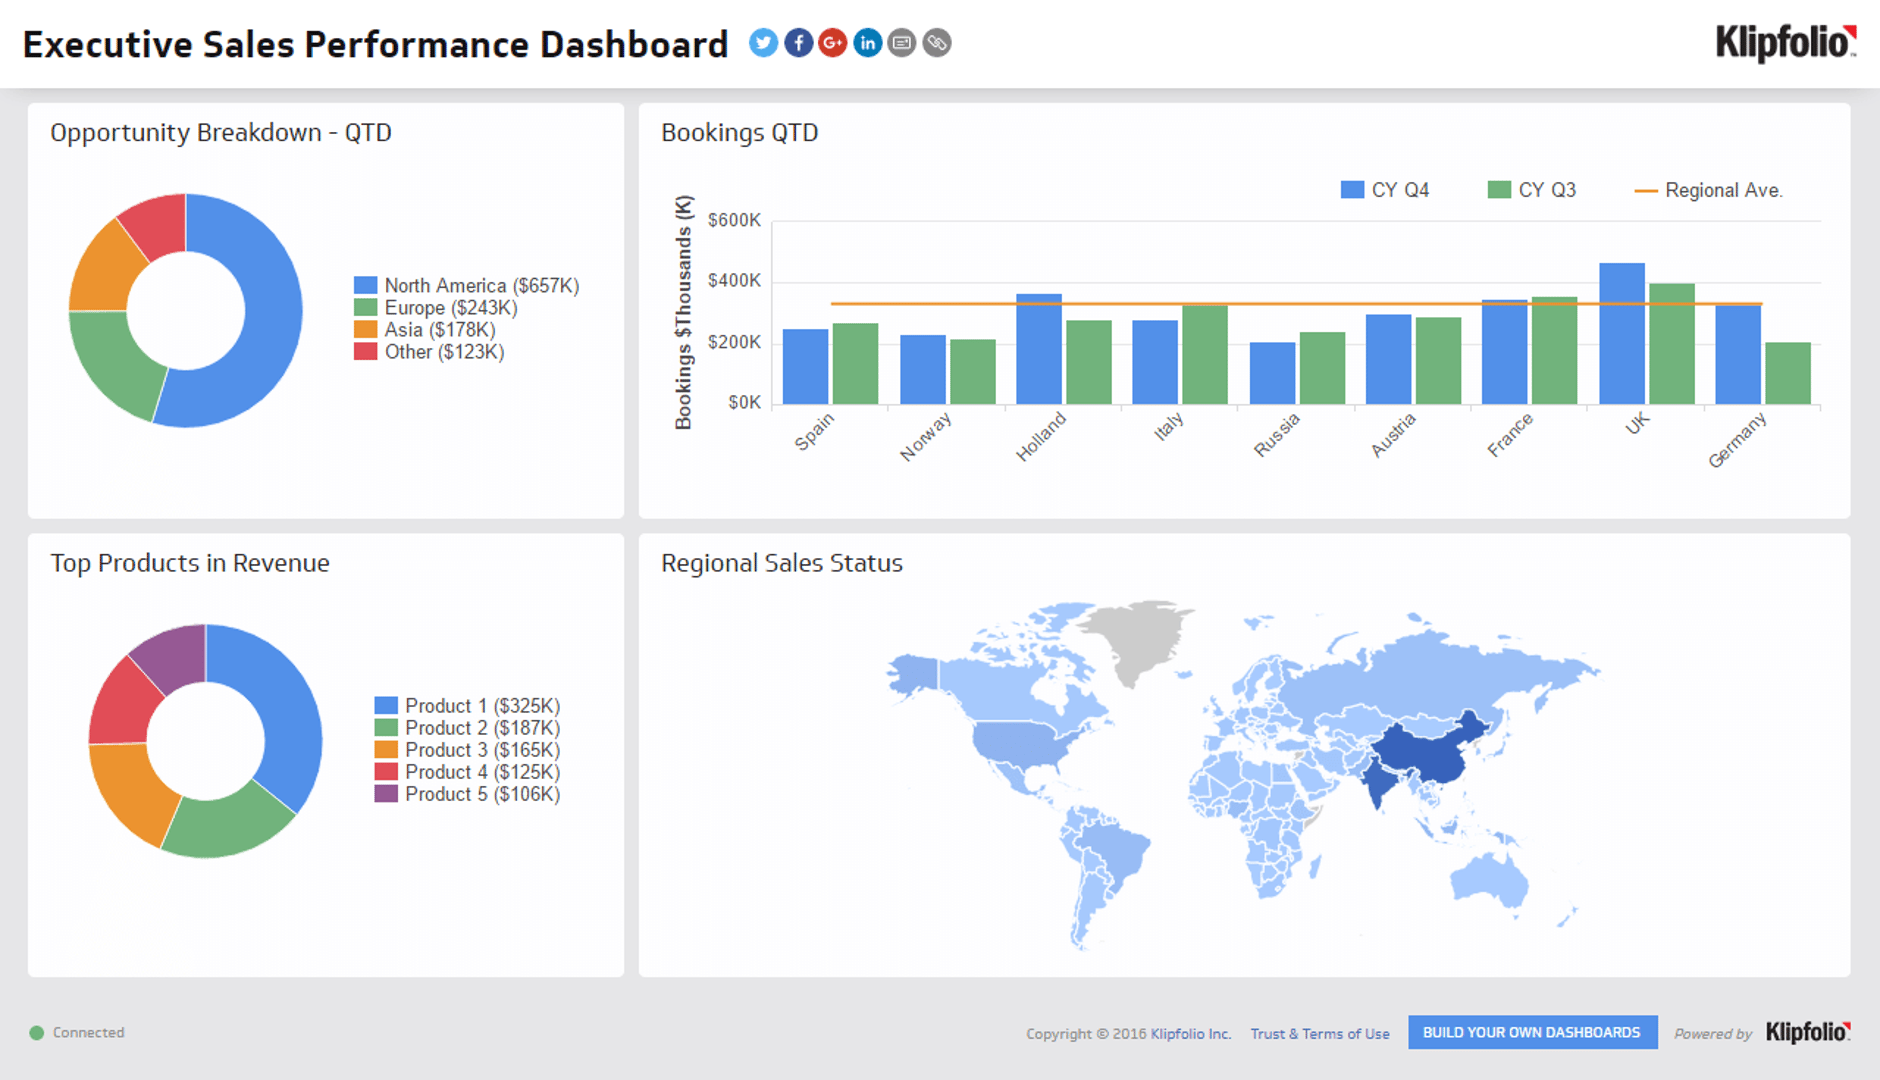
Revenue and wins by type
Understand what types of opportunities are bringing in the most revenue.
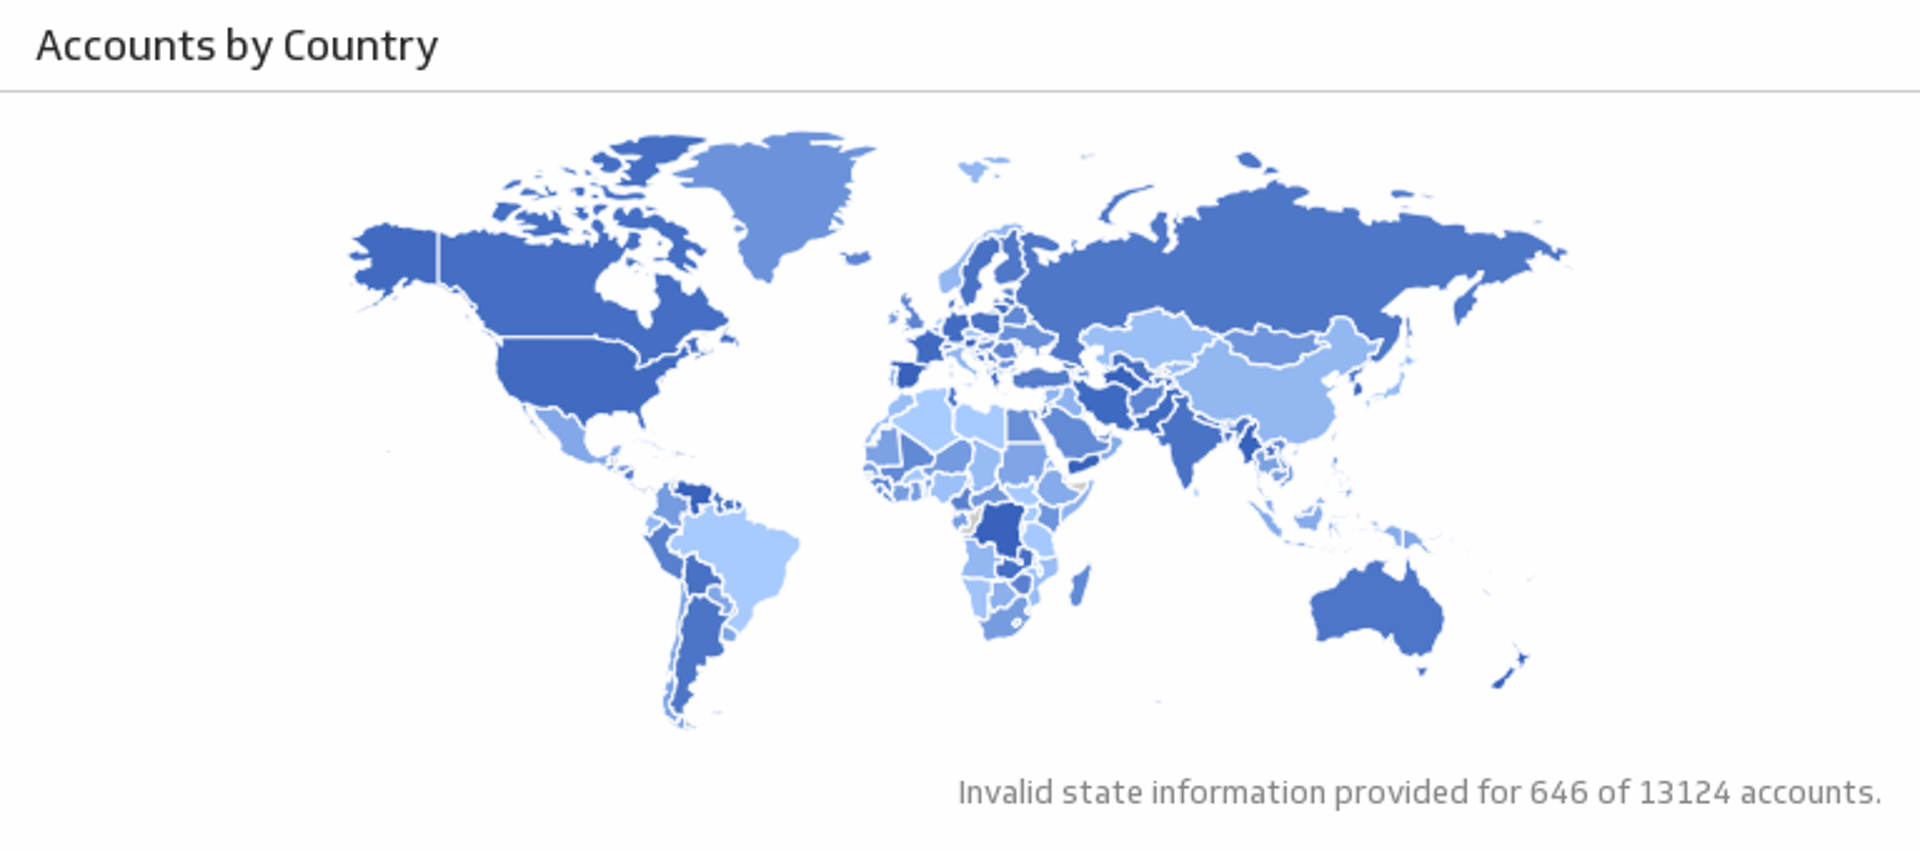
Accounts by country
See the location of your Salesforce accounts.
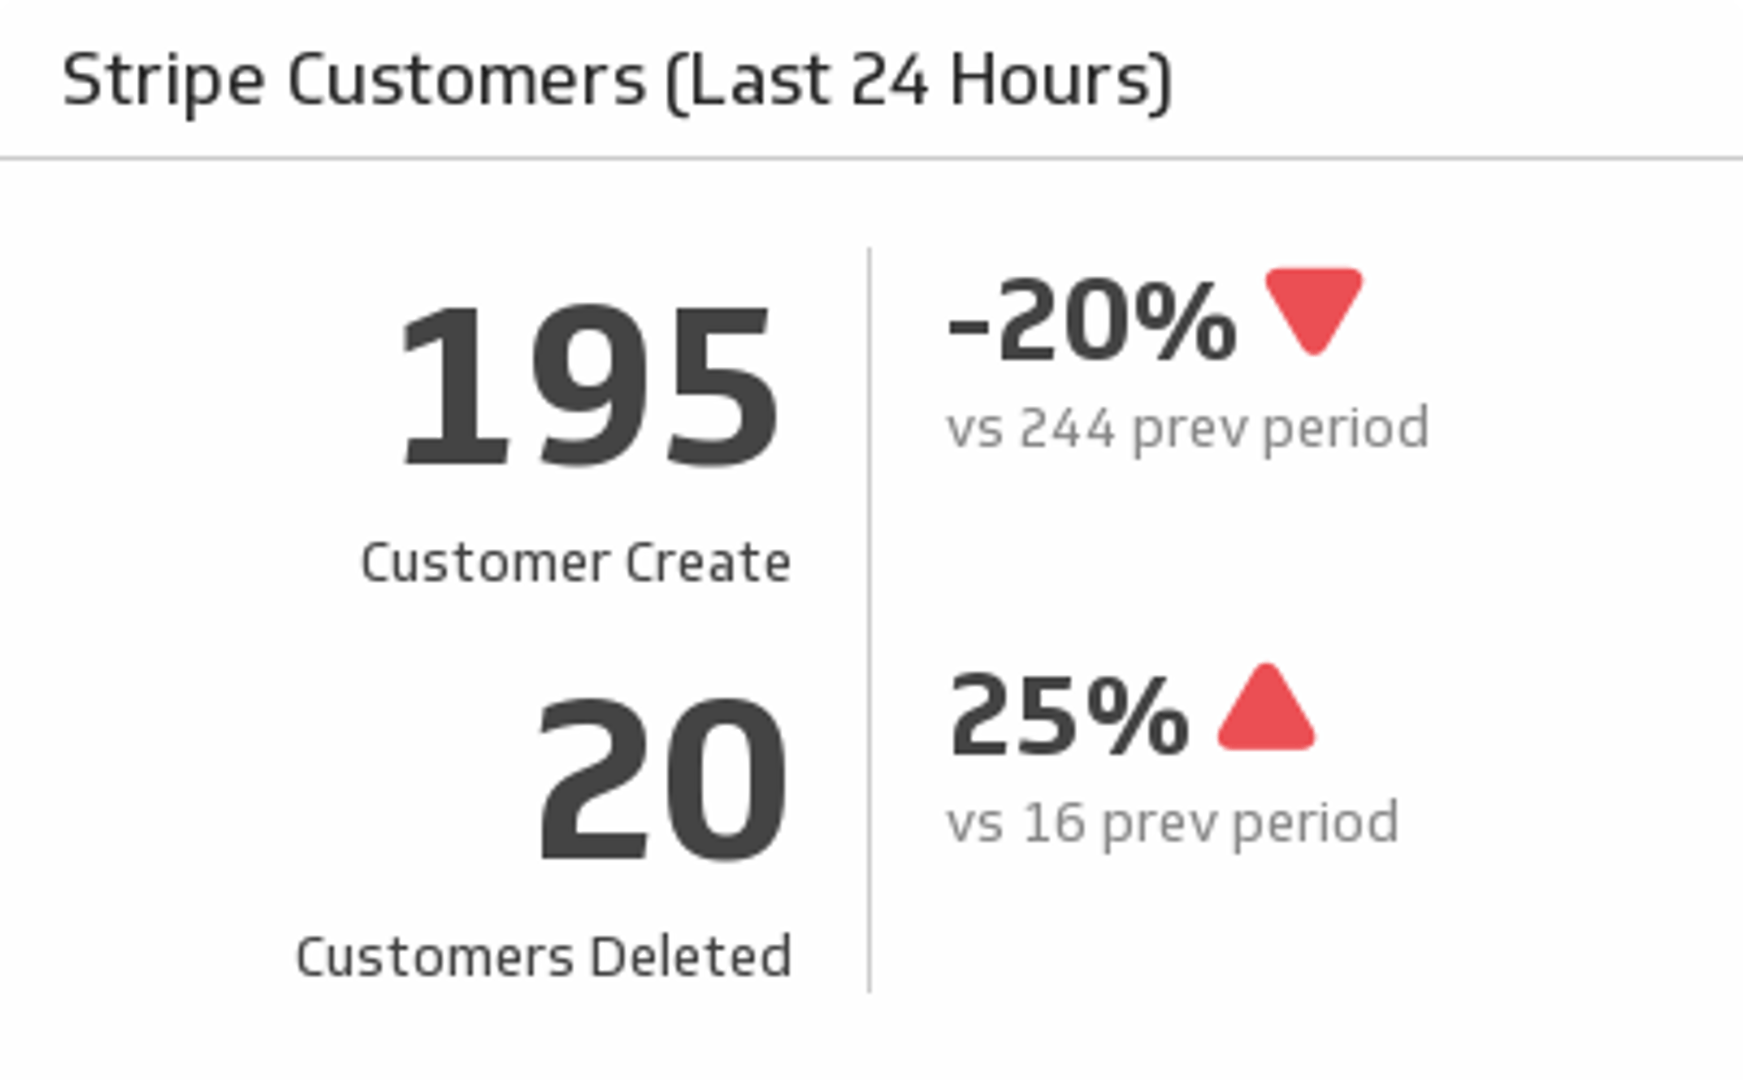
Customers (last 24 hours)
Discover how many Stripe customers you have gained and lost in the past 24 hours, and compare to the previous period.
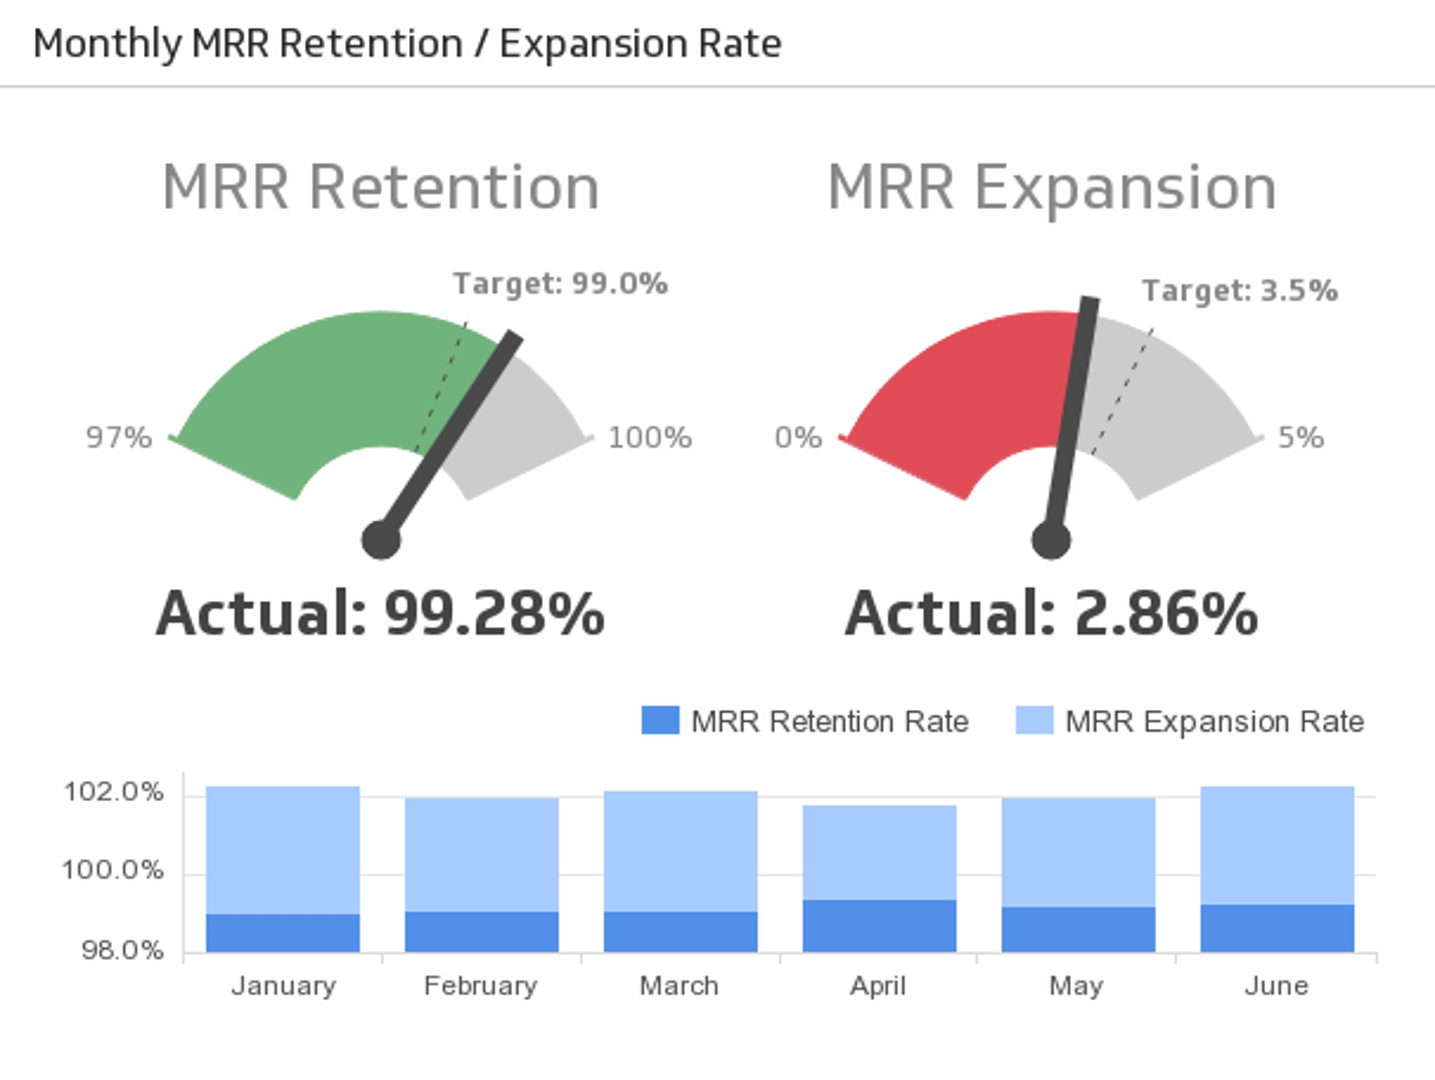
MRR retention / expansion rate
Monthly Recurring Revenue (MRR) is central to many businesses. Track how effectively your team retains and grows expected monthly revenue.
Start building your monthly sales dashboard
A monthly sales dashboard replaces scattered spreadsheets with a single, always-current view of your team's performance. When everyone sees the same numbers, decisions happen faster and targets stay front of mind.
Klips connects to your CRM and other data sources so you can build a fully customized dashboard in minutes. Try Klips free — no credit card required.
At a glance
Focus Area
Monthly sales performance tracking for sales teams using CRM data
Metrics List
Sales today, new accounts, MRR this month, expansion MRR, MRR retention rate, sales by region
Related Dashboards
View all dashboards