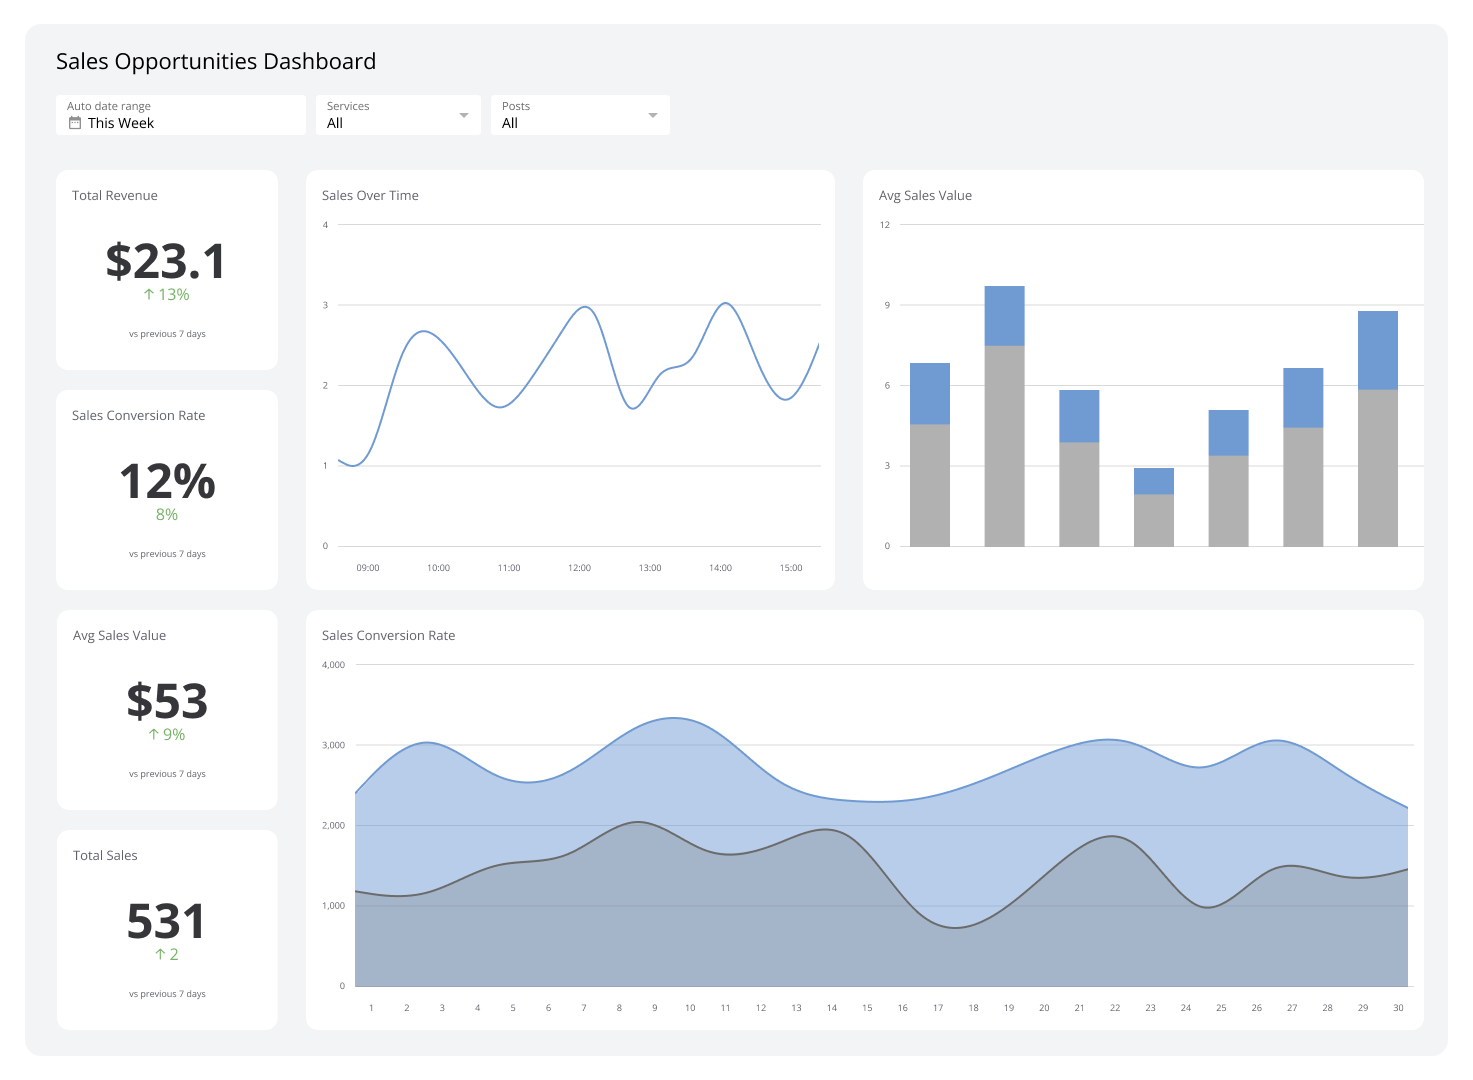
Sales Opportunities Dashboard
Your sales pipeline, visualized in real-time.
What is a Sales Opportunities Dashboard?
A sales opportunities dashboard is a real-time visual tool that tracks potential deals from first contact to close, giving your team a clear view of pipeline health.
Is your sales pipeline a black box? This dashboard consolidates data on deal stages, potential revenue, and closing probabilities into a single view. By monitoring your sales pipeline with a dashboard like this, your team can prioritize high-value opportunities, spot bottlenecks early, and make informed decisions to accelerate growth.
Key metrics for your sales opportunities dashboard
An effective sales opportunities dashboard moves beyond simple lead tracking and tells you the complete story of your pipeline's health. Here are the essential metrics to monitor:
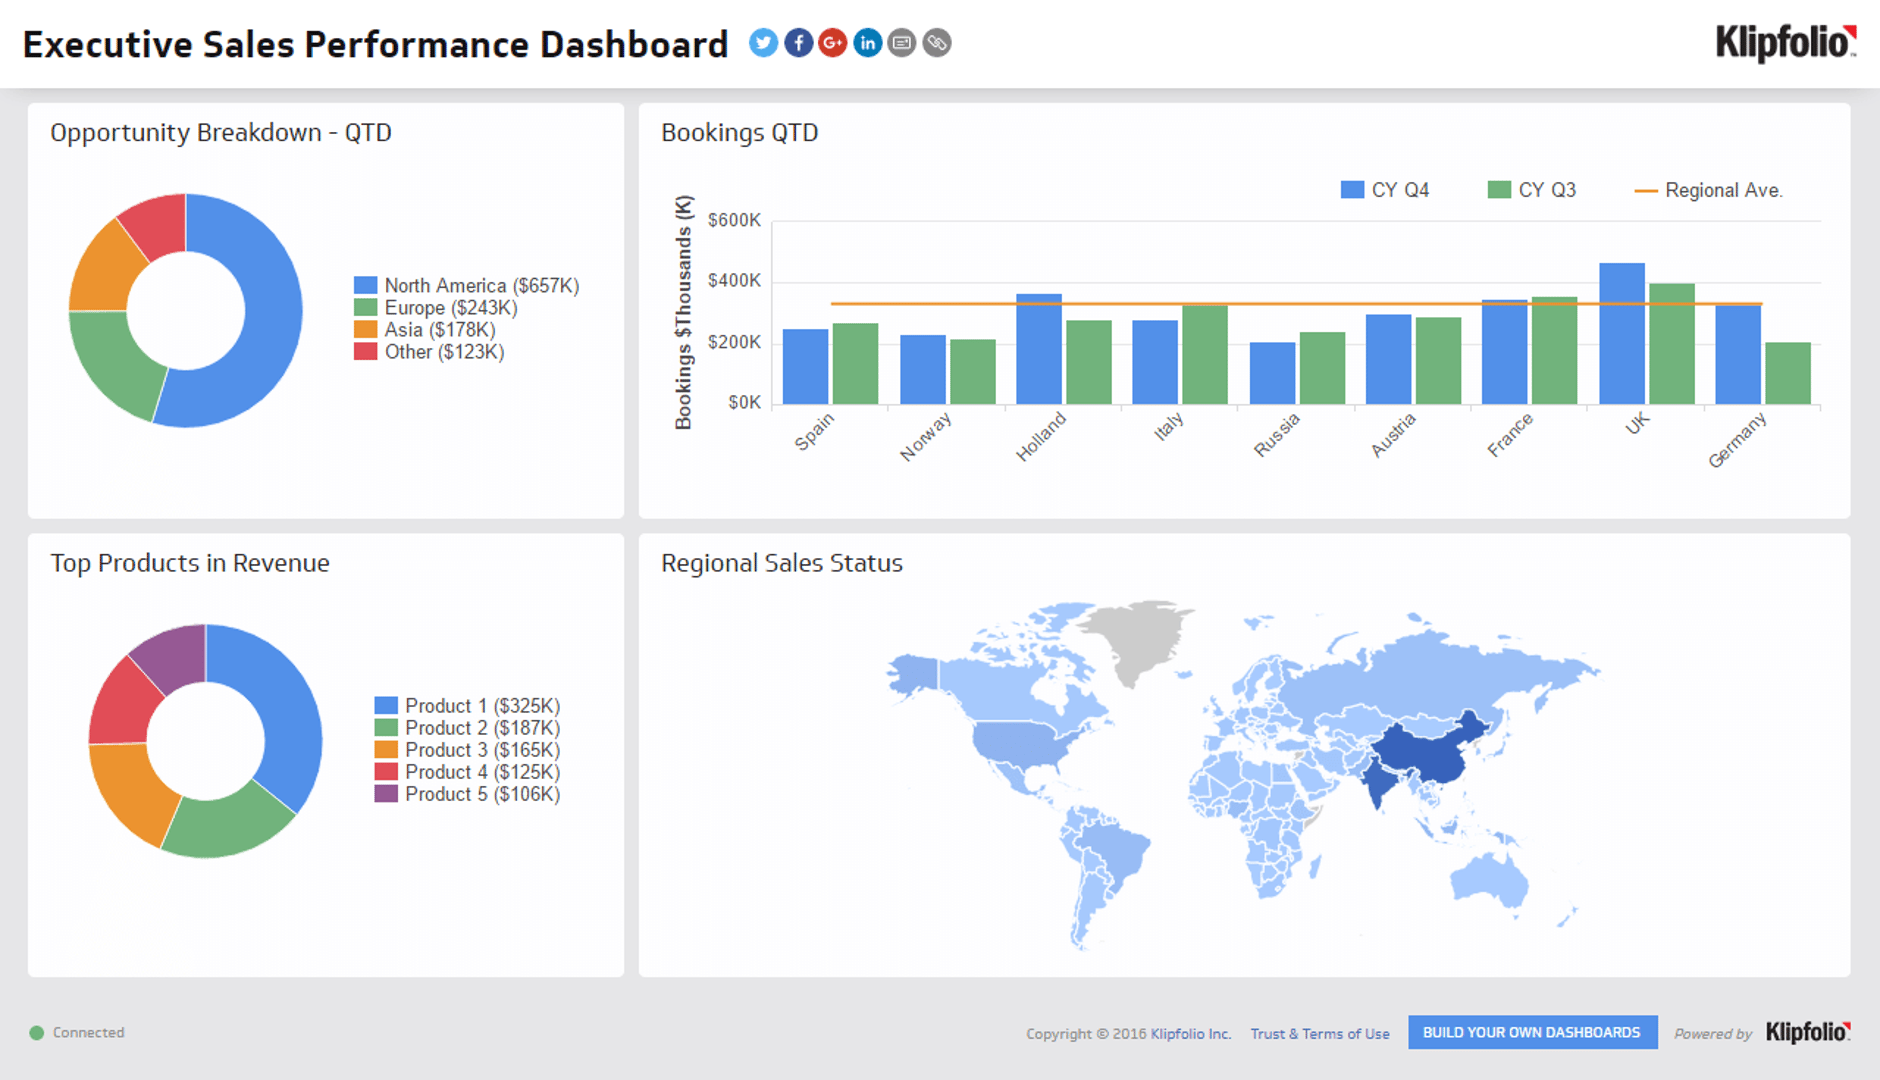
Pipeline value by stage: See the potential revenue sitting in each stage of your sales funnel. This is critical for accurately forecasting future revenue and identifying where deals are getting stuck.
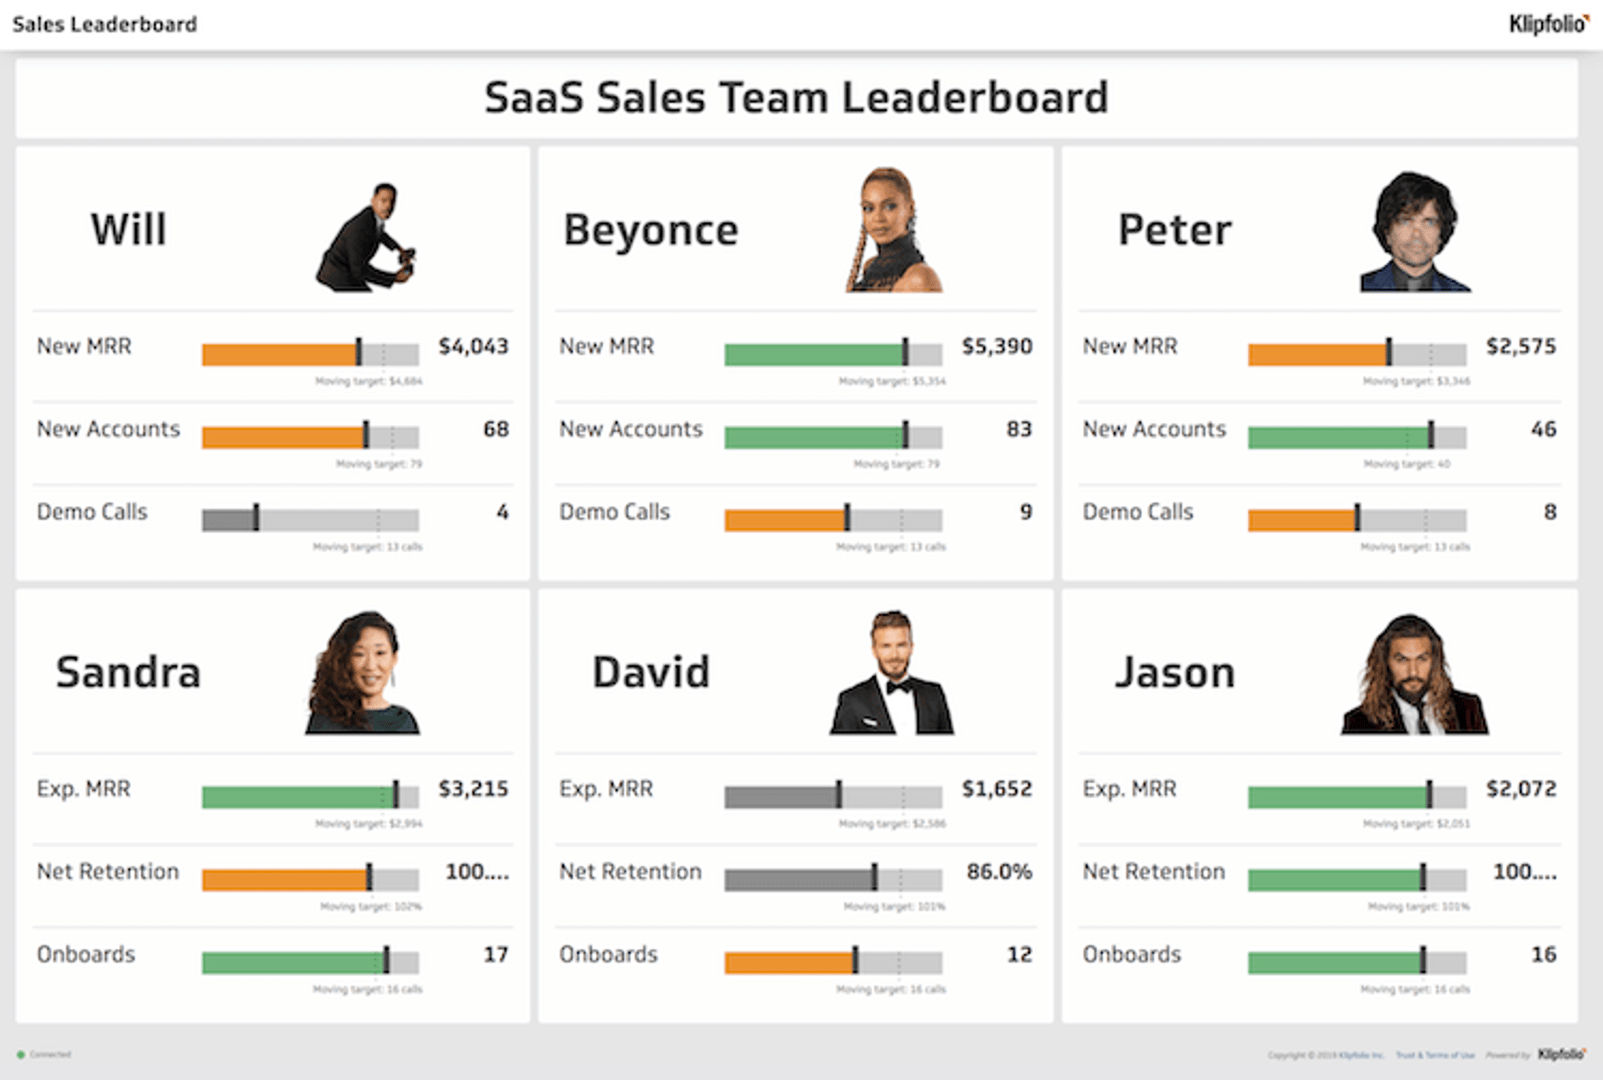
Number of open opportunities: Track the volume of leads your team is actively working. A healthy, growing pipeline gives you the buffer you need to consistently hit sales targets.
Win rate: Calculate the percentage of opportunities your team successfully closes. This is a key indicator of sales effectiveness and helps you understand what's working in your strategy.
Sales cycle length: Measure the average time it takes to turn a lead into a customer. Shortening your sales cycle — even by a few days — compounds across your entire pipeline.
Lead source performance: Identify which channels are generating your highest-quality opportunities. This helps you invest in the right acquisition strategies and cut what isn't converting.
Build your sales opportunities dashboard with Klips
Stop managing your pipeline from complex spreadsheets and static CRM reports. Klipfolio Klips connects directly to your data sources, so you can build a custom sales opportunities dashboard examples that gives your entire team real-time visibility into what's moving, what's stalling, and where to focus next.
At a glance
Focus Area
Sales pipeline management, opportunity tracking, revenue forecasting
Metrics List
Pipeline value by stage, number of open opportunities, win rate, sales cycle length, lead source performance
Reference Rate
Real-time to daily refresh recommended for active sales teams
Related Dashboards
View all dashboards