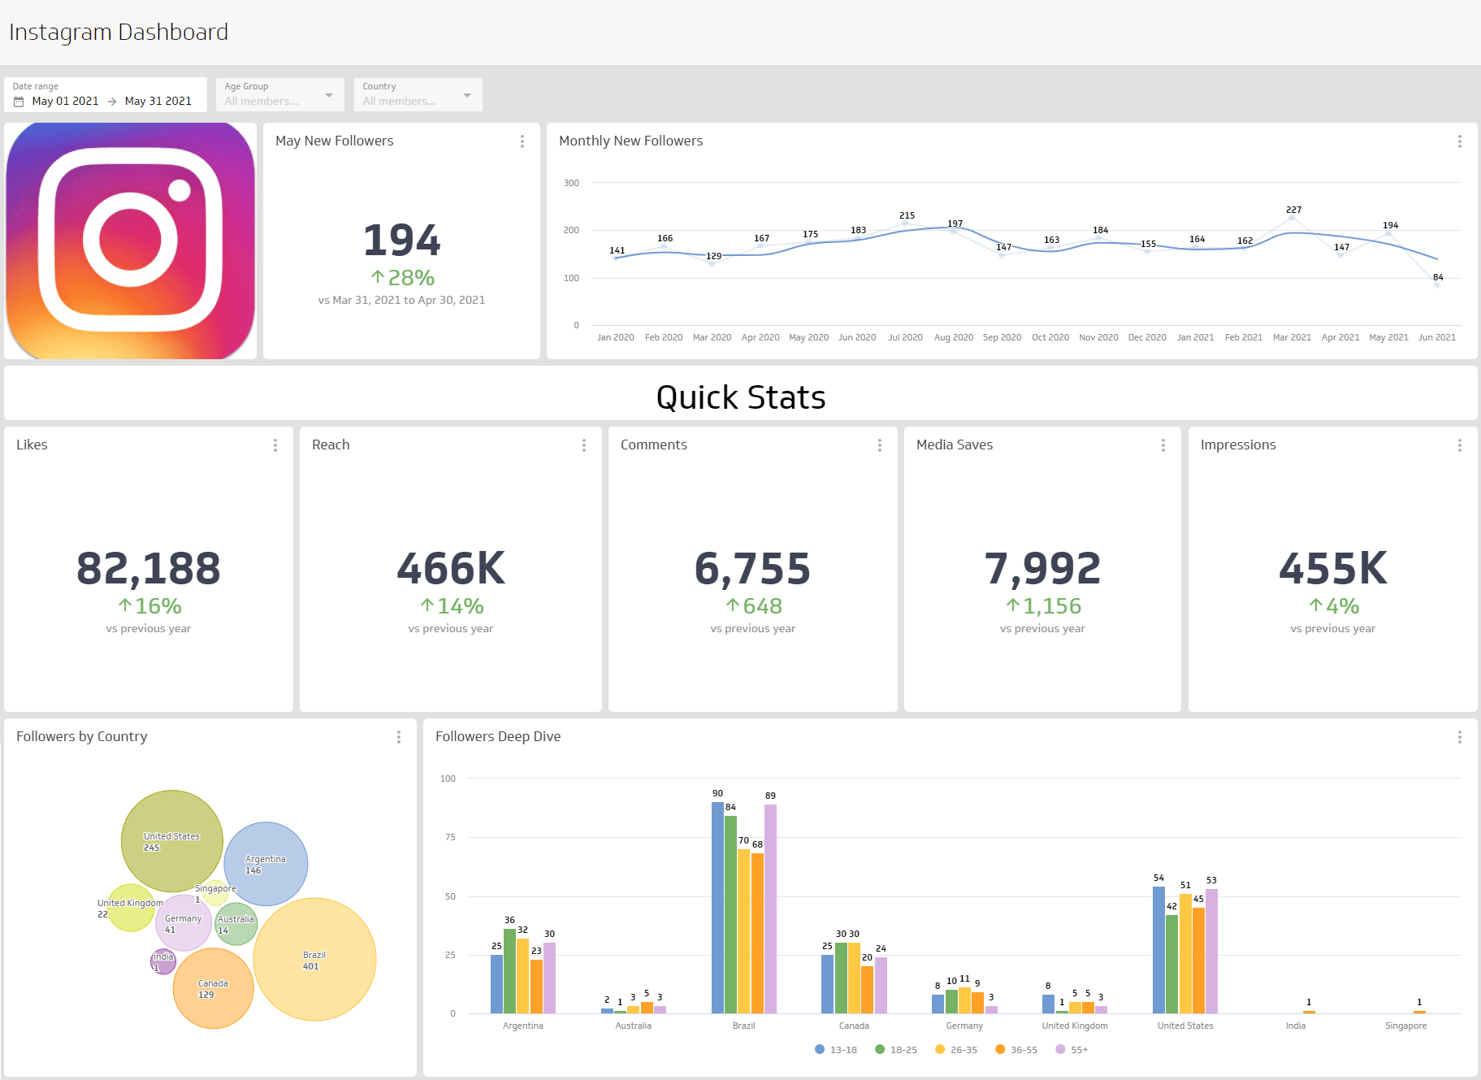
Instagram Dashboard
Track reach, engagement, and growth in one clear Instagram dashboard.
What is an Instagram Dashboard?
An Instagram dashboard is a visual report for your Instagram account. It brings the metrics and KPIs you care about into one place so you can spot trends and act faster. Use it to answer questions like:
- How many unique accounts viewed your content this week or month?
- How fast is your follower count growing?
- Do carousels, single images, or video get more engagement?
With a dashboard, you can segment data and see how your audience interacts with each content type and timeframe.
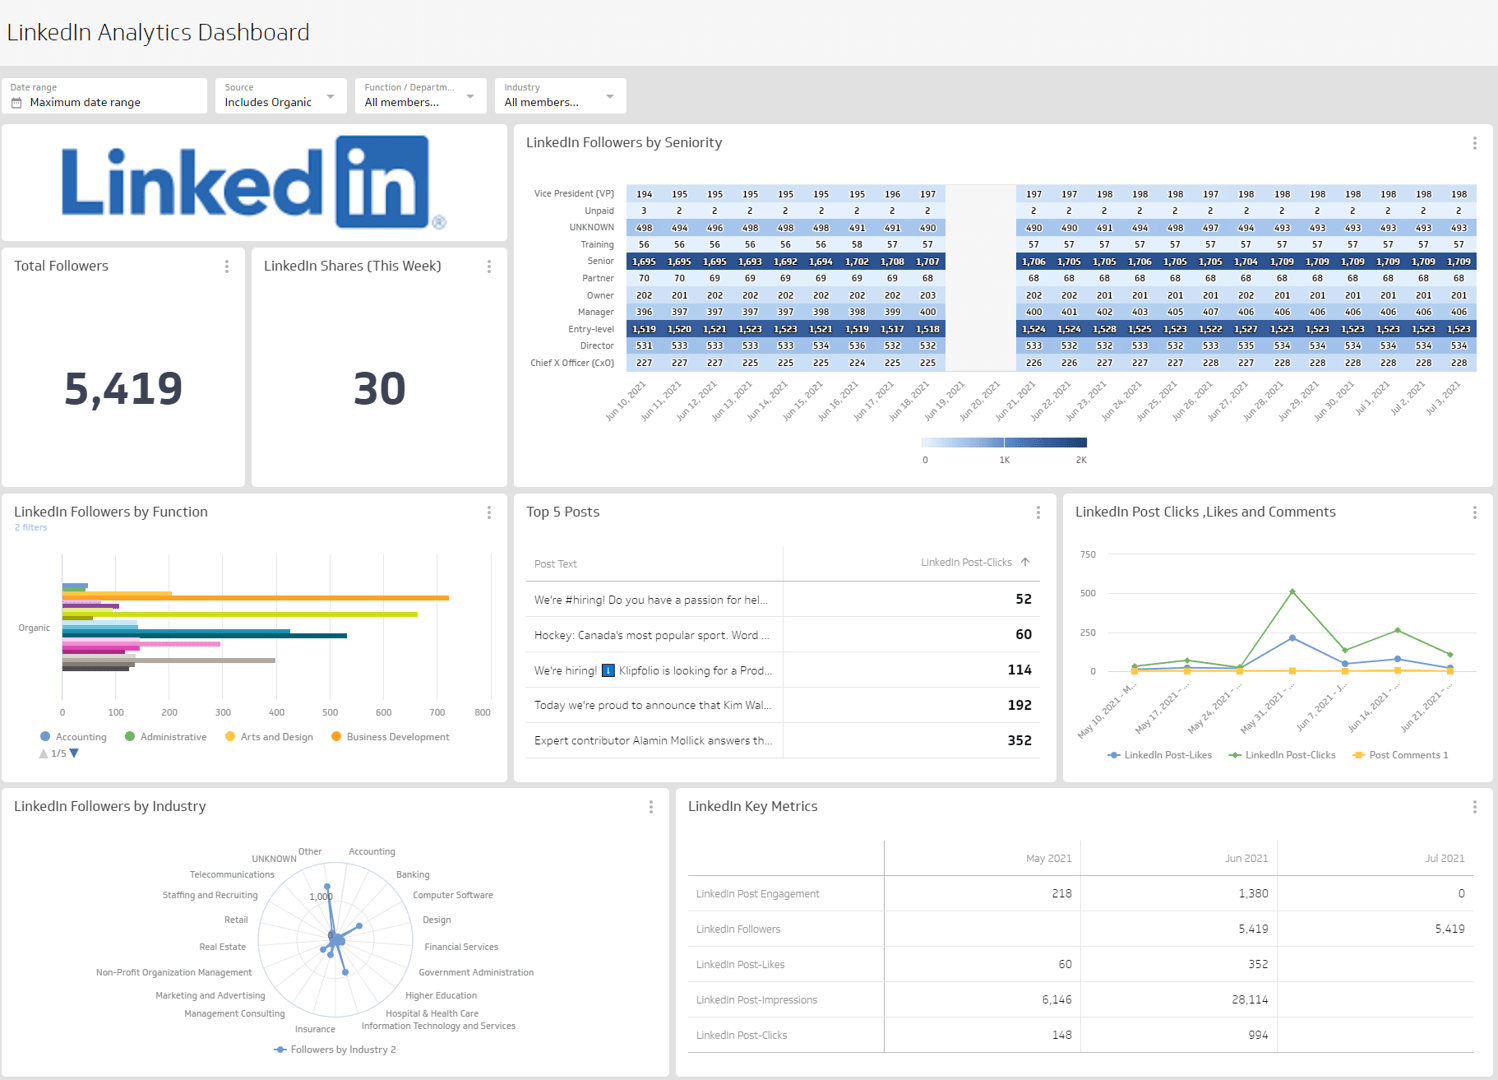
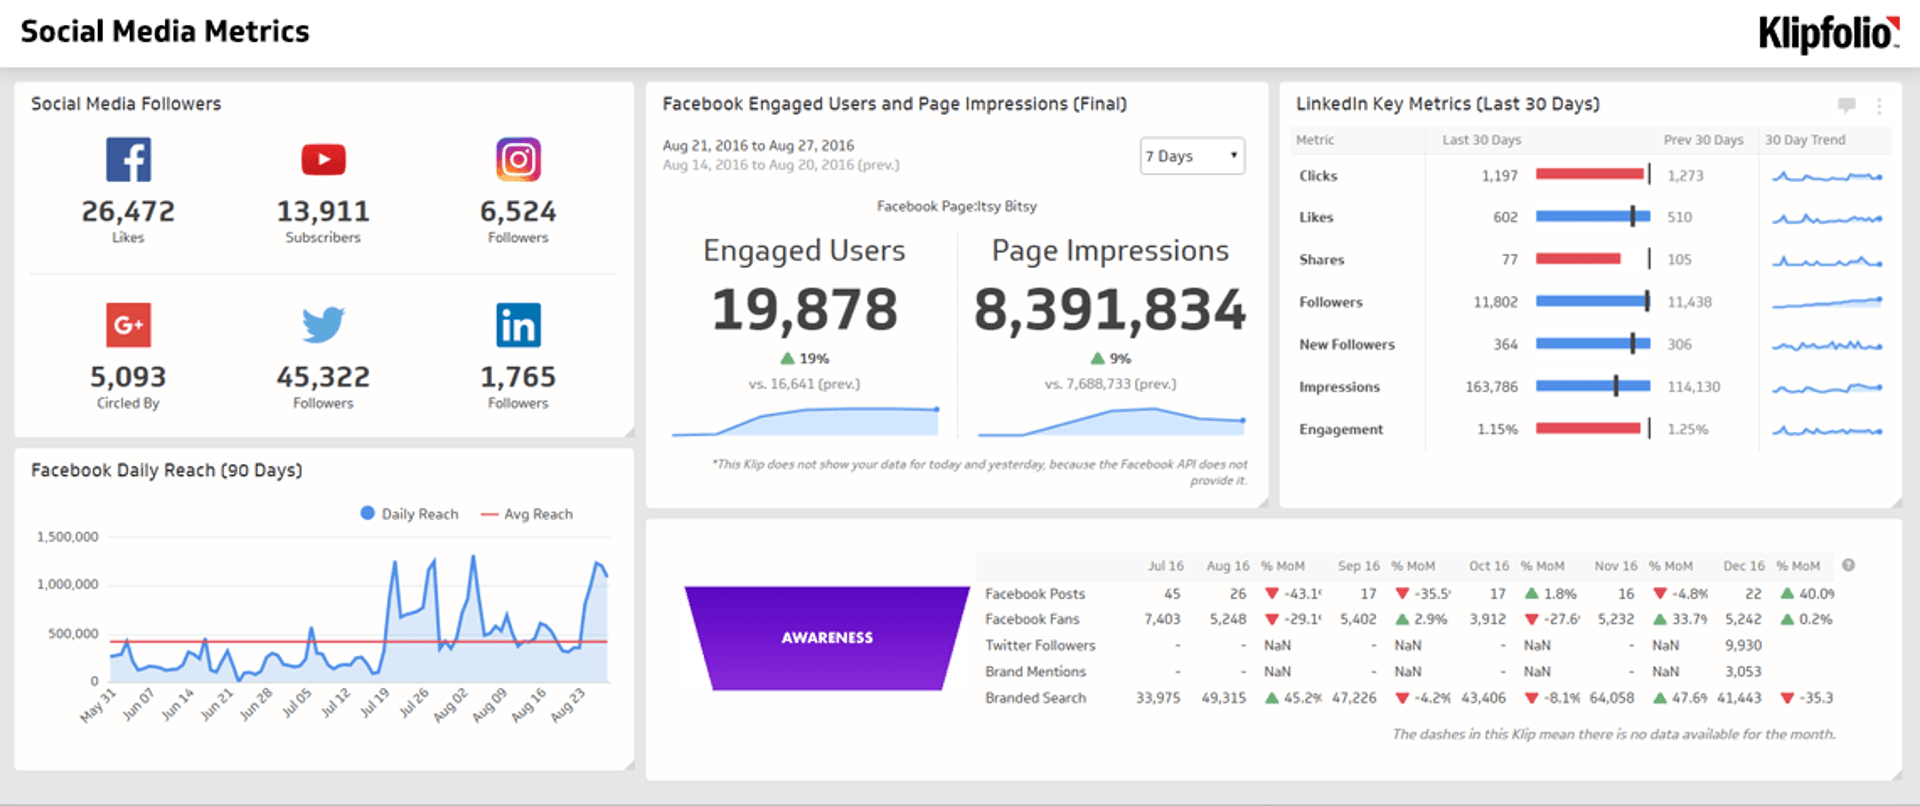
What metrics should be included on an Instagram dashboard?
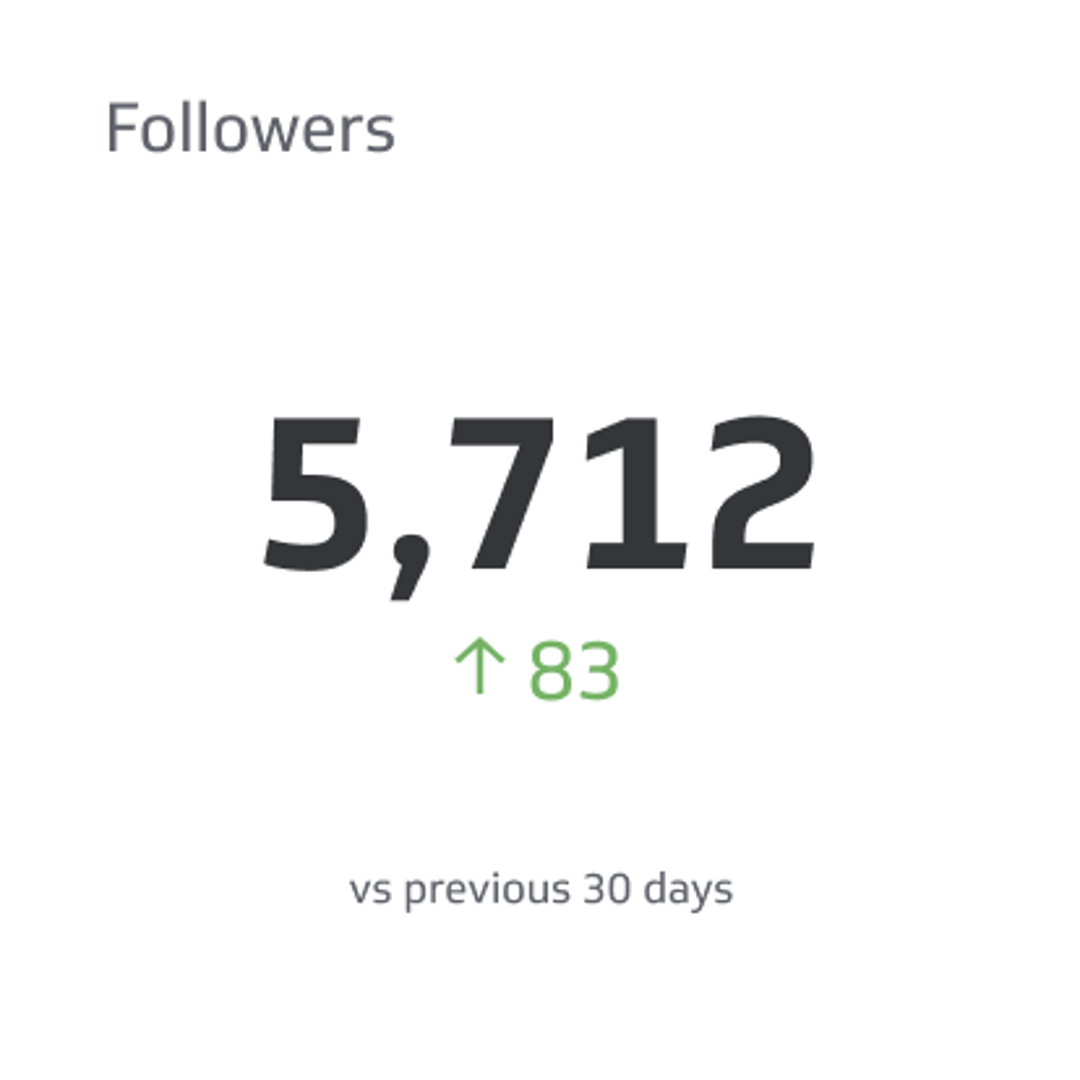
Followers
Followers is the number of users who chose to follow your posts.
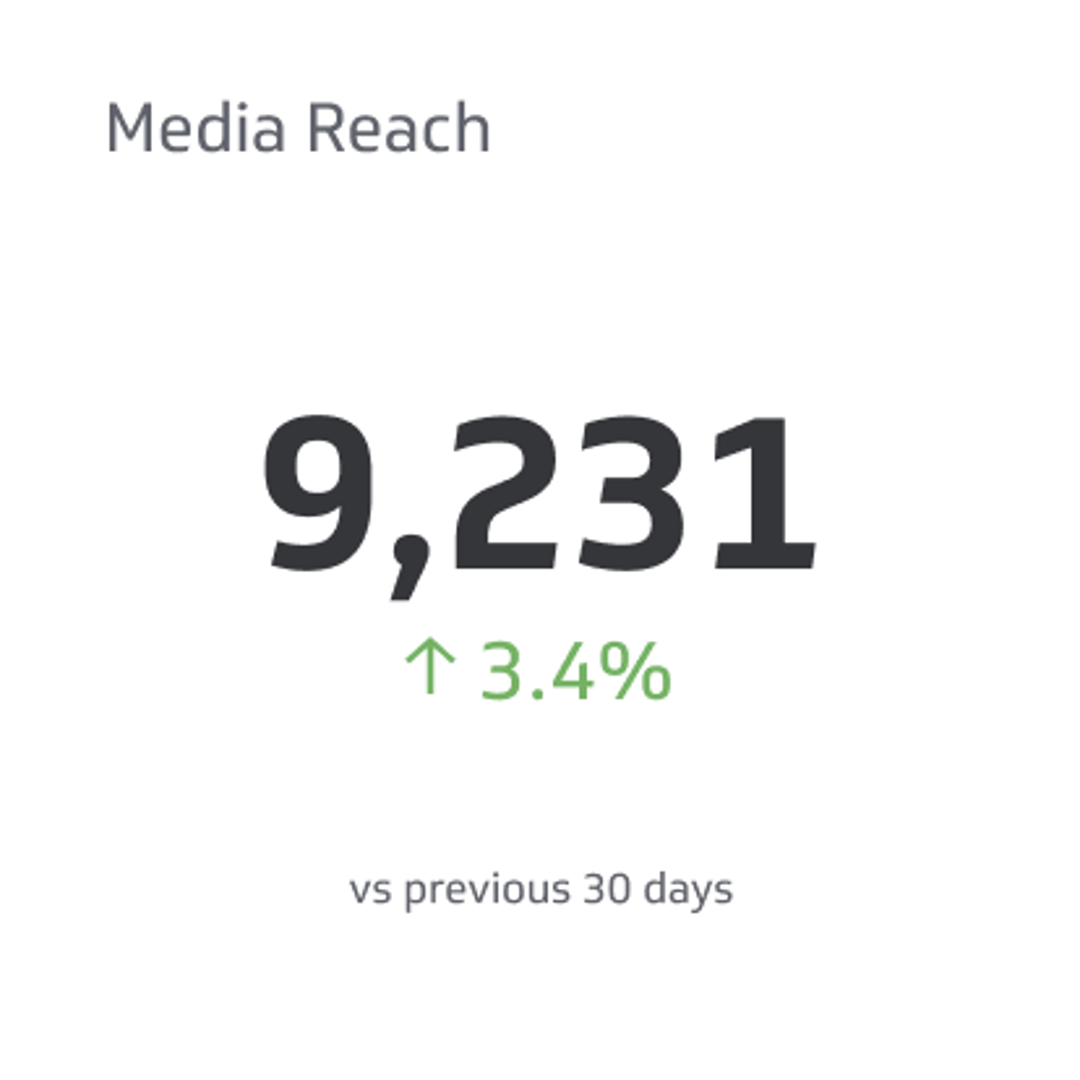
Media Reach
Media Reach measures how many people were exposed to your content.
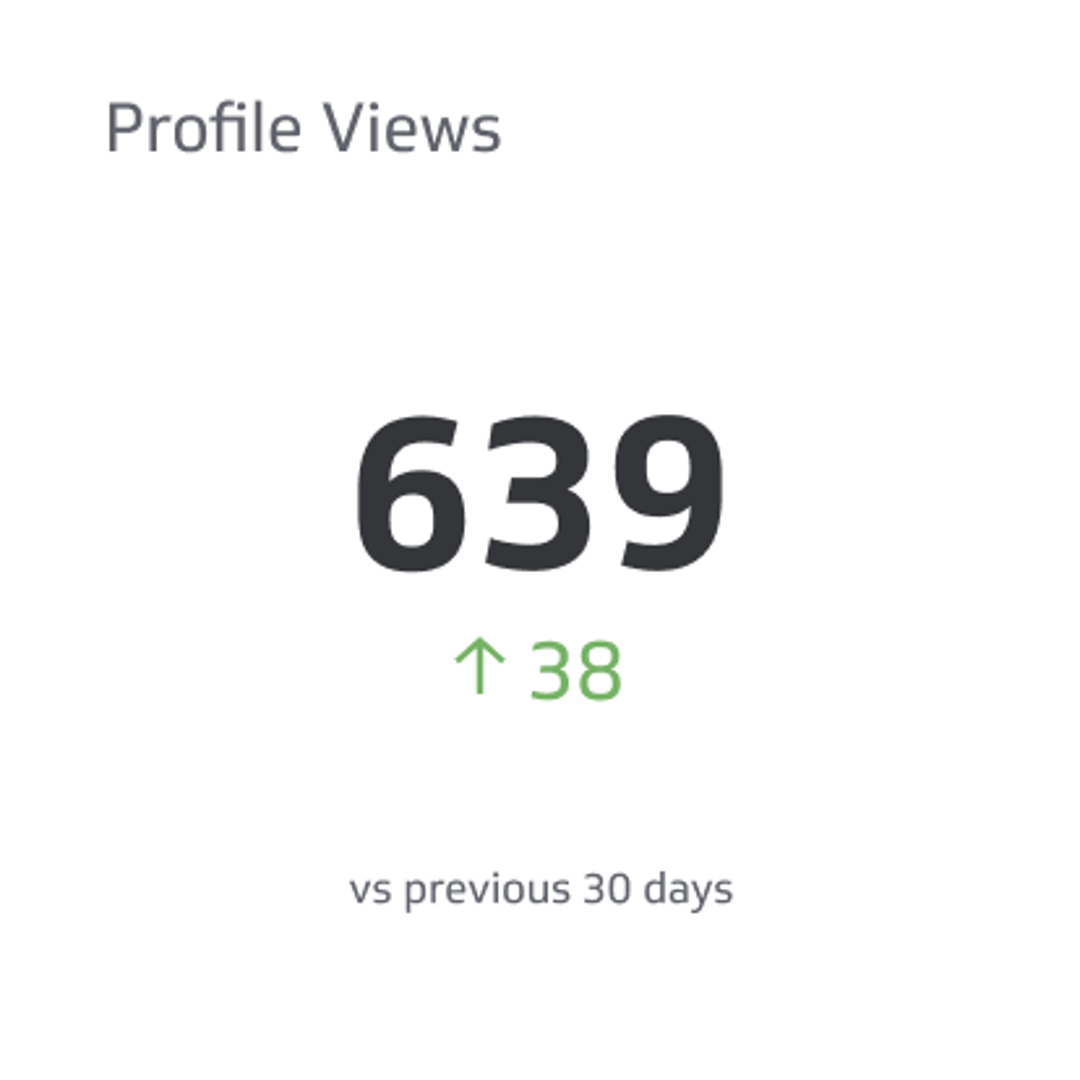
Profile Views
Profile Views counts total views of your profile from unique accounts over a period of time.
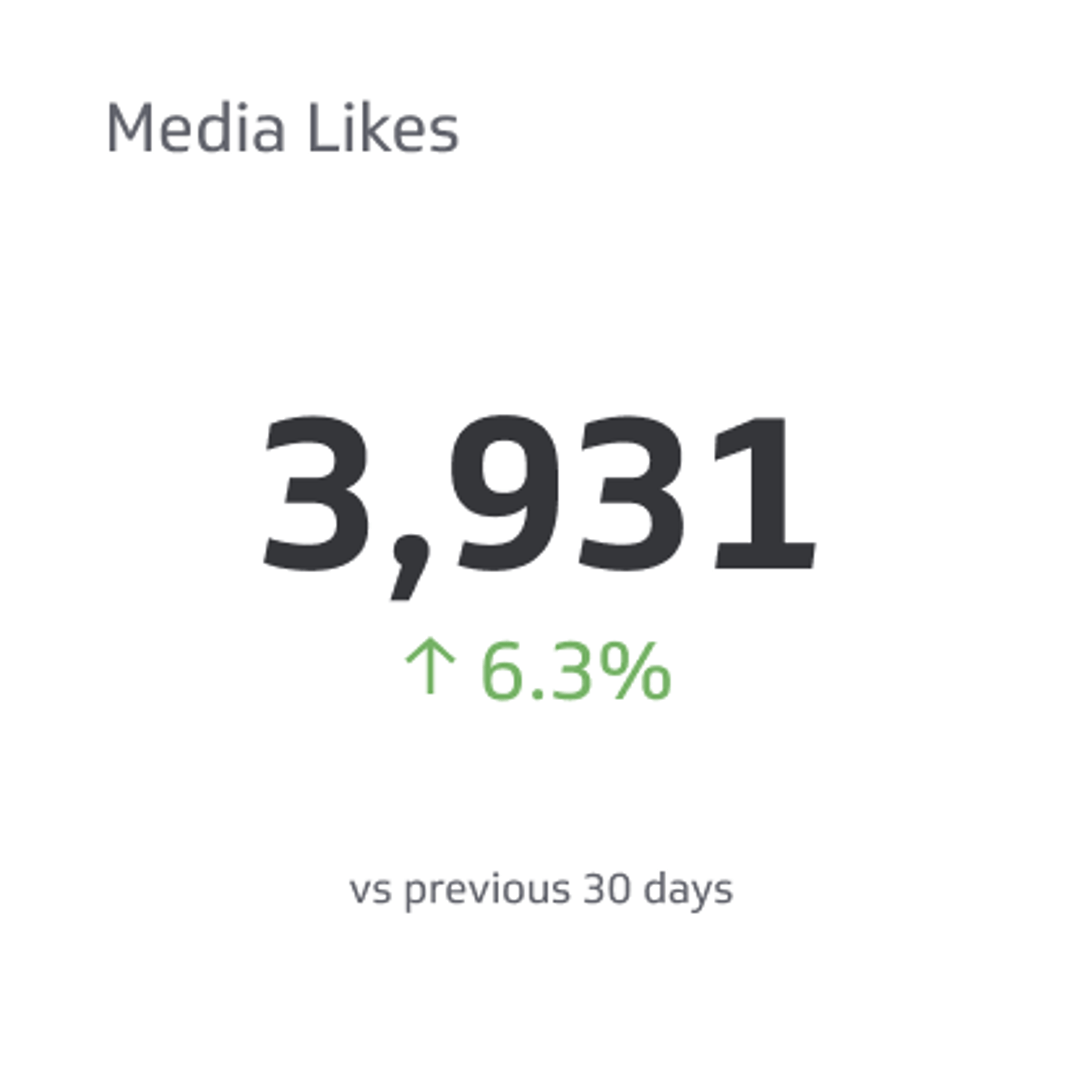
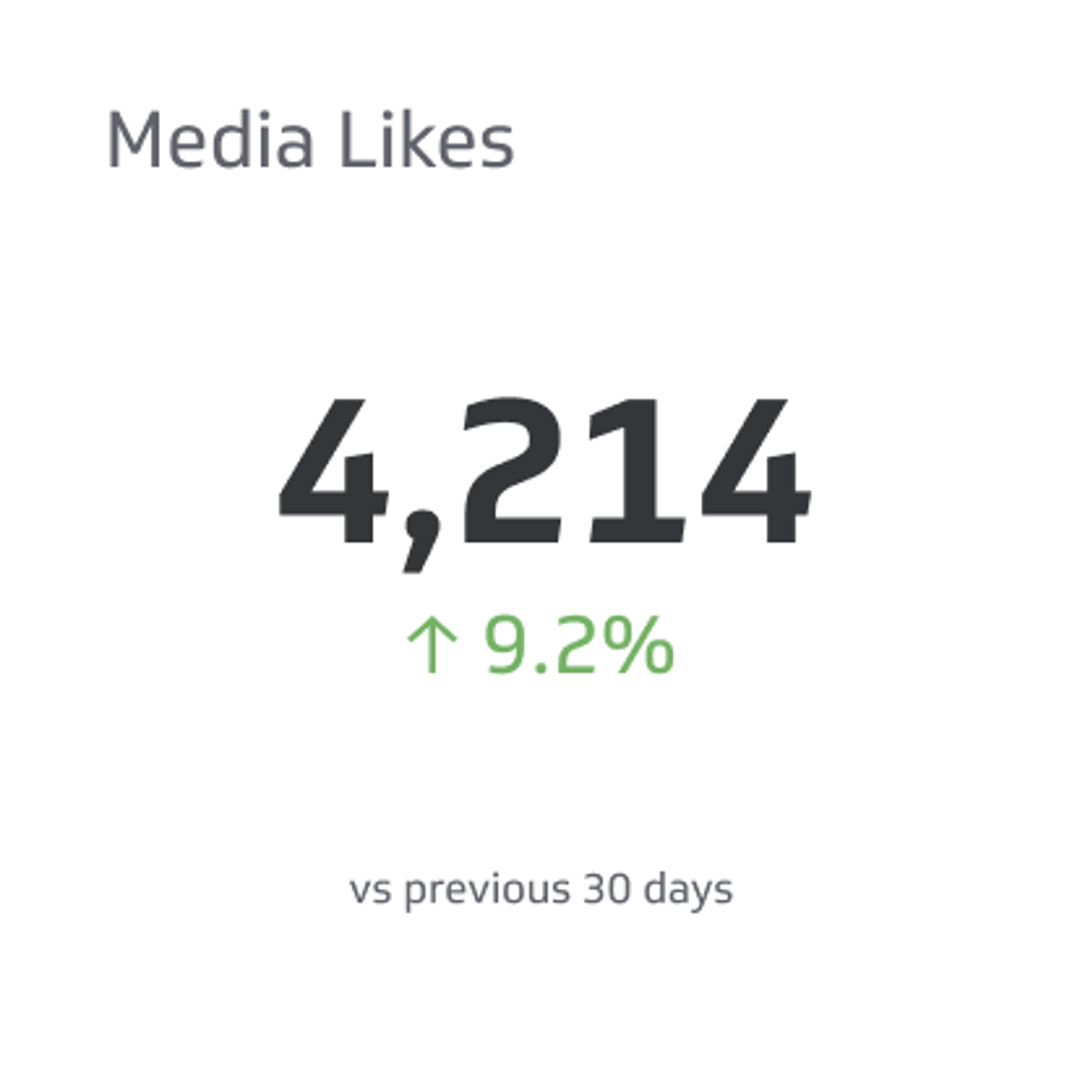
Media Likes
Media Likes is the total count of likes you receive on posts.
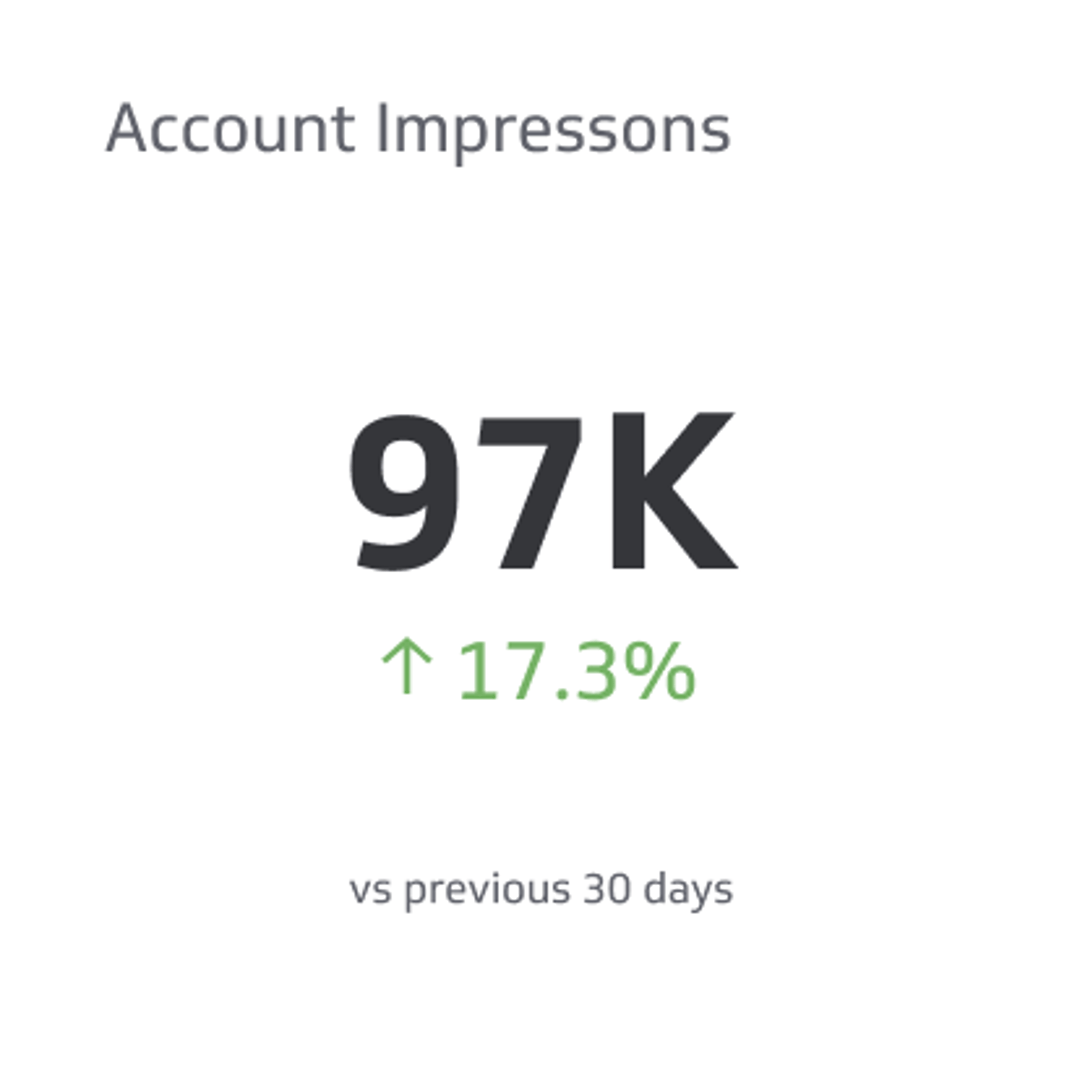
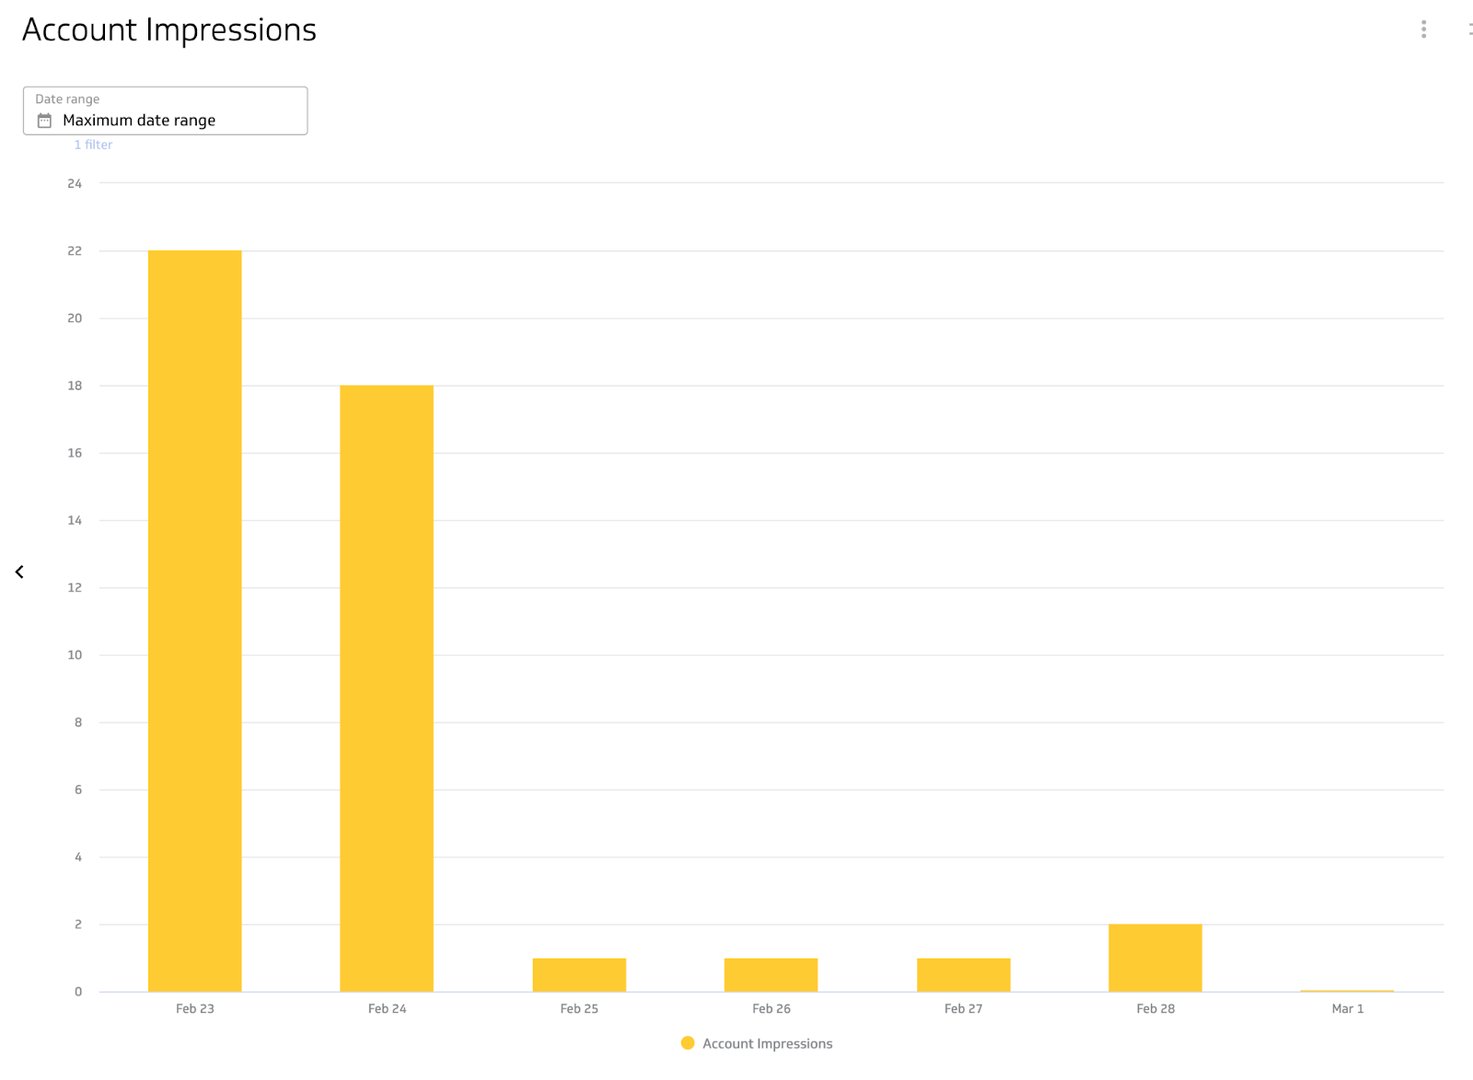
Account Impressions
Account Impressions counts total times posts or ads from your account were viewed.
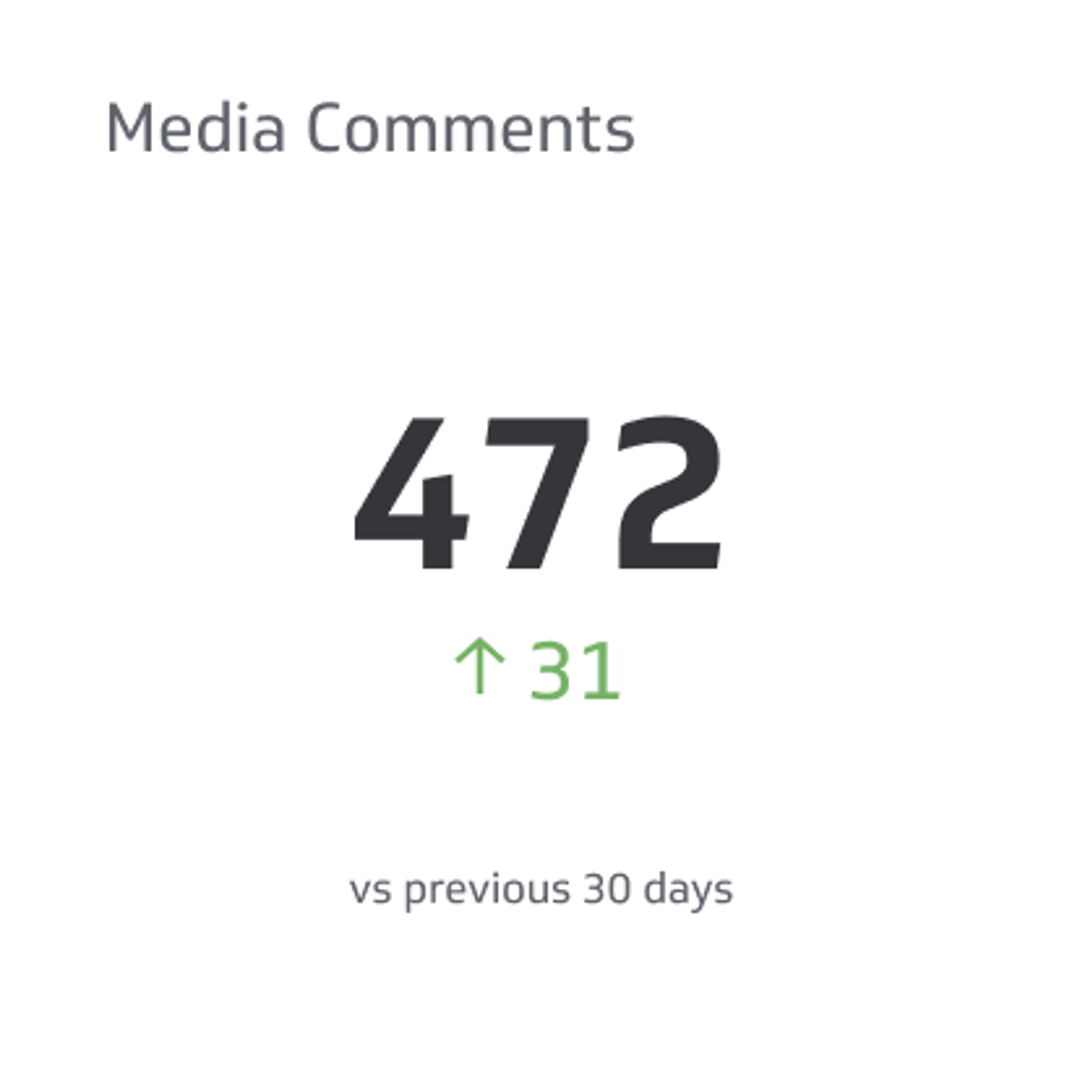
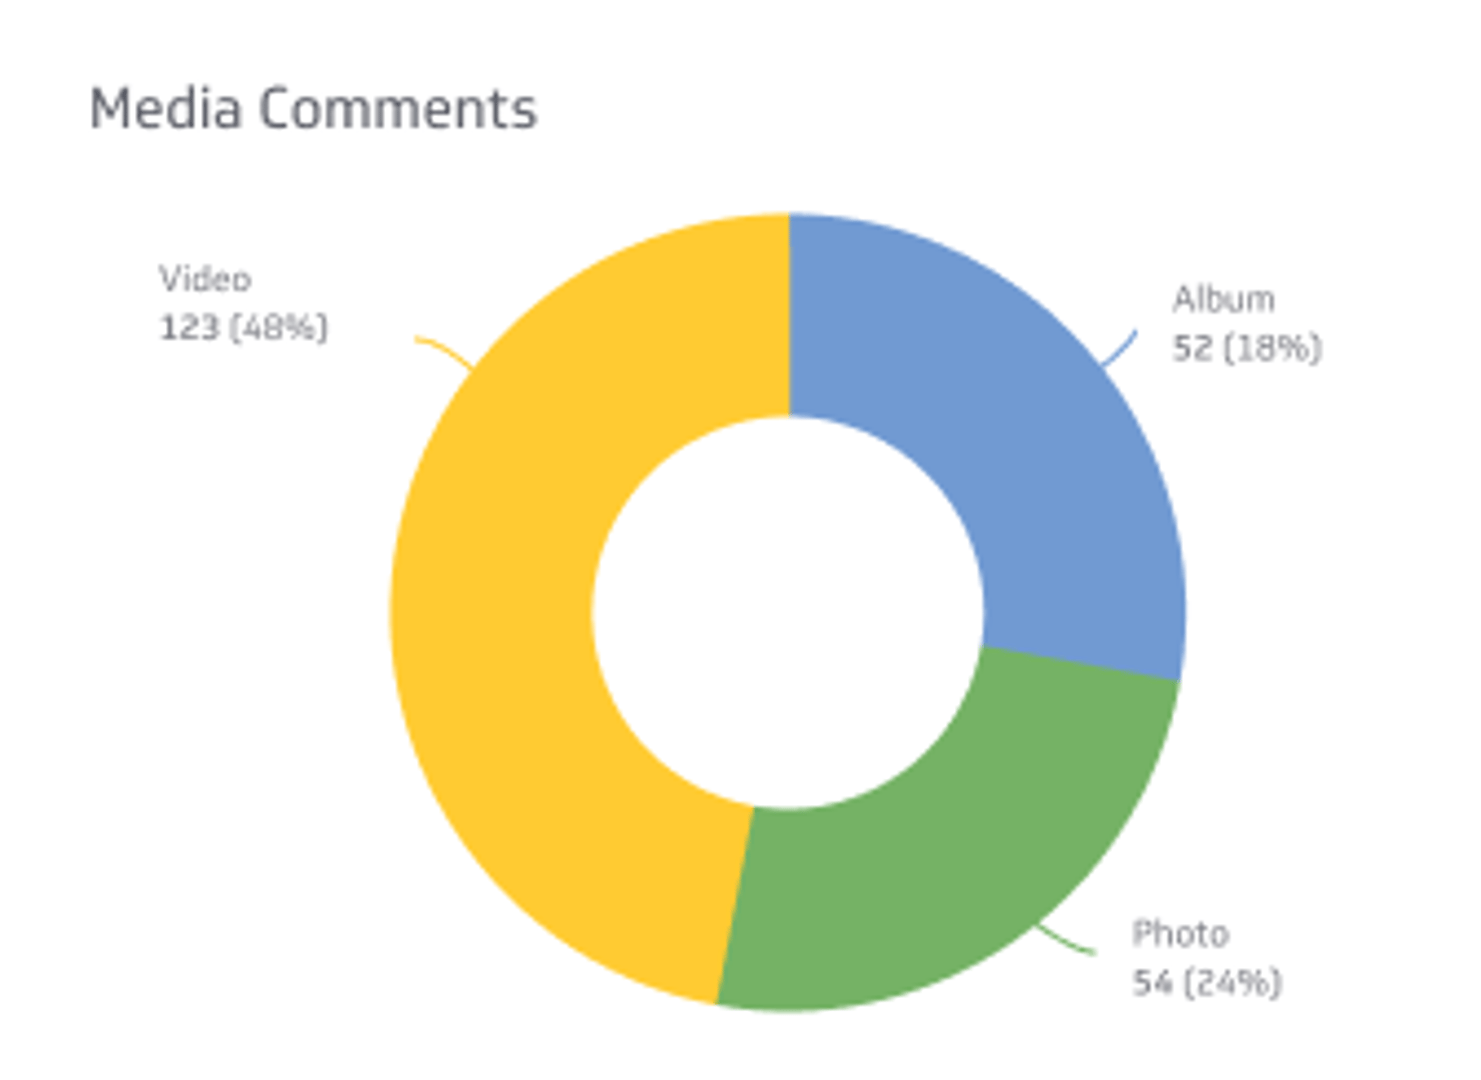
Media Comments
Media Comments is the total count of comments on your content.
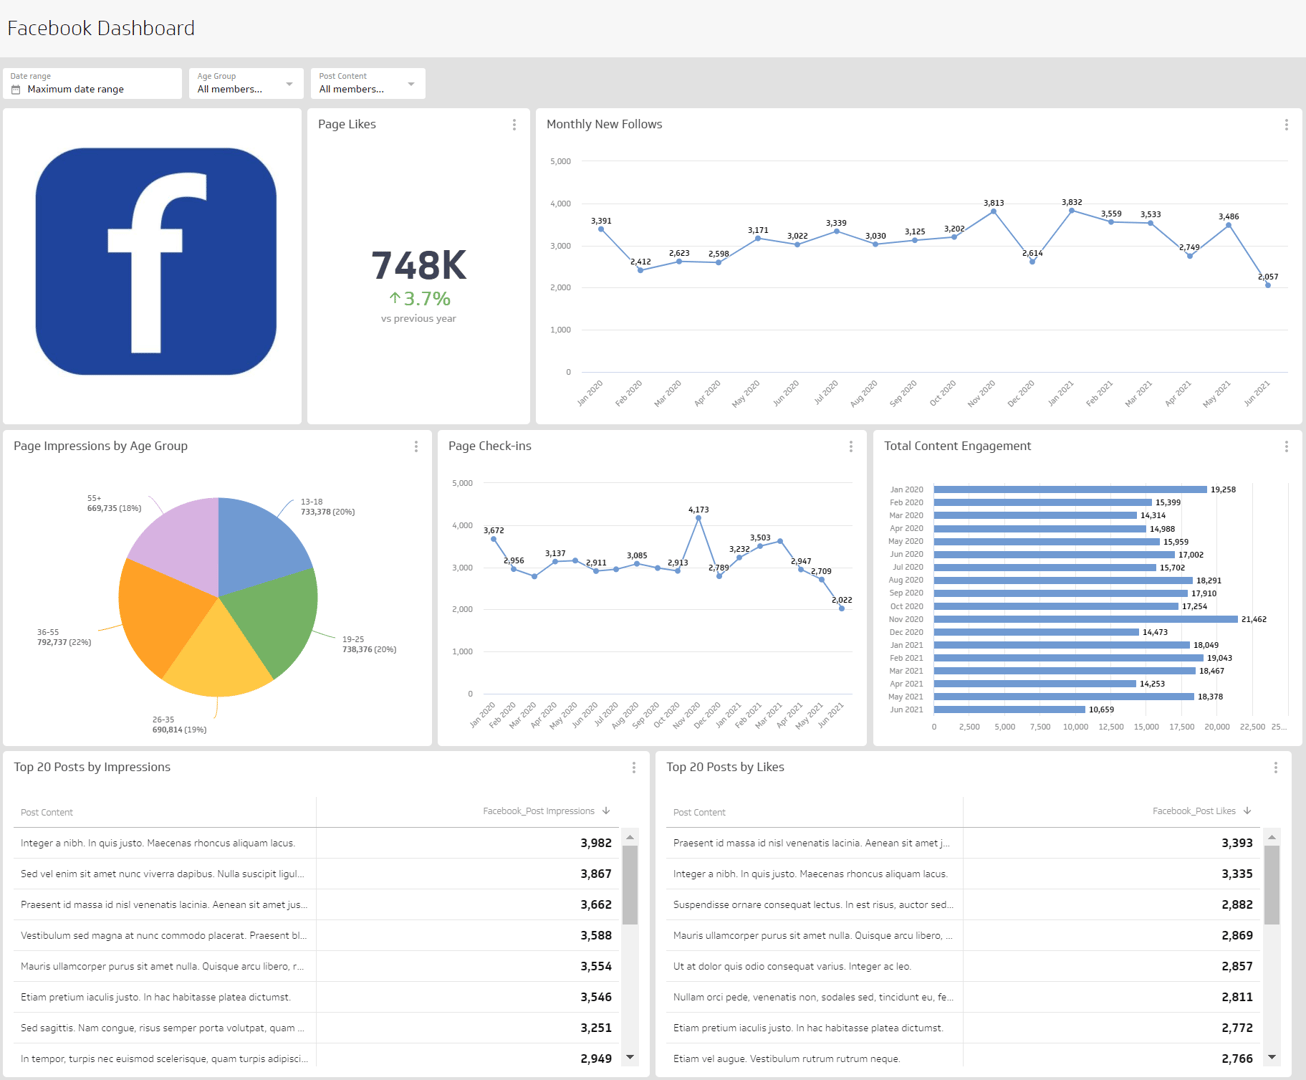
What type of visualization works best on an Instagram dashboard?
Start with the goal. Are you building a social media dashboard for quick monitoring, or do you need deeper segmentation? Your choices should match the decisions you plan to make.
Instagram segments metrics like comments, engagement, likes, reach, and saves by type. In Klips, you can segment by time and by media type (carousel, single image, or video) when your data source includes that breakdown.
To compare progression over time
Use a line or bar chart for time-based metrics such as impressions, reach, or followers. View day over day, week over week, or month over month to spot patterns.
To show a single value
Use a summary chart for totals like media likes or saves. It gives you a fast read at a glance.
To see parts of a whole
Compare media types with a pie or stacked bar. For example, break out engagement by carousel, image, and video to see what wins.
Benefits of an Instagram dashboard
Native Instagram analytics are helpful for quick checks and tend to be mobile-first. A Klips dashboard gives you more control. You can adjust date ranges, choose the best visualization for each metric, and share the view with your team by link, TV mode, PDF export, or scheduled email.
Dashboard inspiration for Instagram
Getting started can be the hard part. Organize metrics so they make sense to you and anyone else who needs to reference the page. Try these ideas.
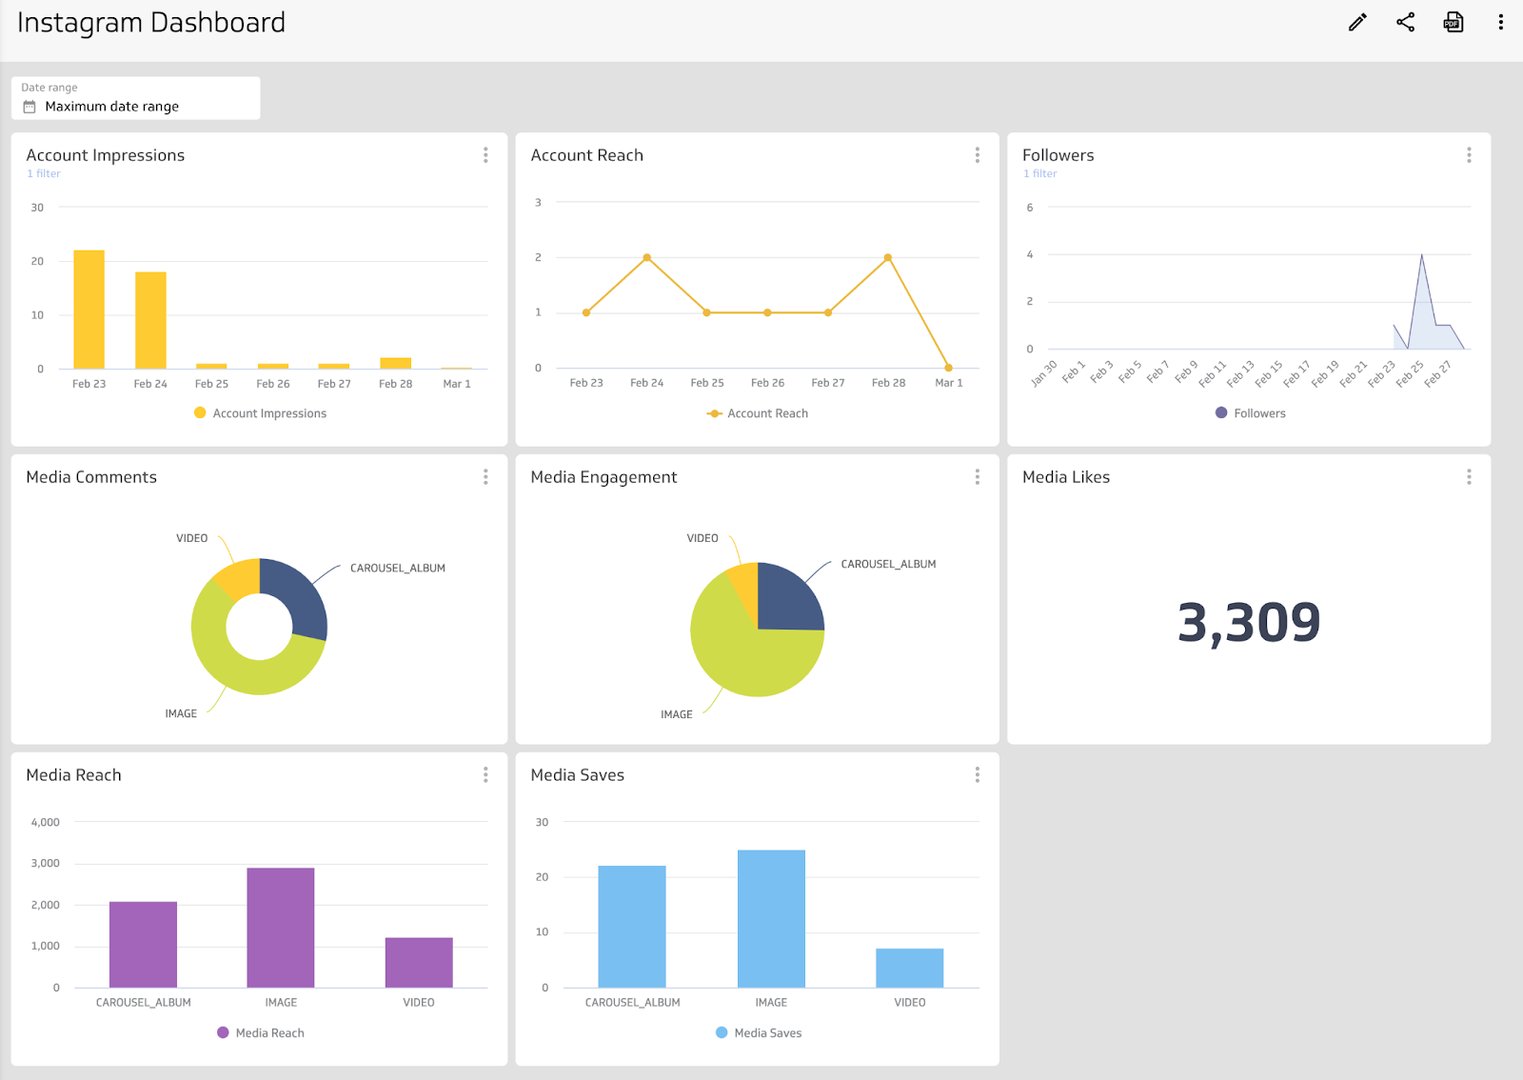
Track overall account performance
Growth, engagement, and reach: put your most important Instagram metrics in one place on an account overview dashboard. This view helps you answer:
- How many accounts is your content reaching?
- Does one media type perform better than another?
- How many followers do you have?
- How are people engaging with content (likes, comments, saves)?
What does success look like with an Instagram dashboard?
A strong Instagram dashboard gives you and your team a clear read on performance. It turns scattered checks into a steady rhythm. When everyone sees the same numbers, you can plan content, test ideas, and repeat what works.
At a glance
Focus Area
Engagement and growth
Metrics List
Followers, Reach, Impressions, Profile views, Likes, Comments, Saves, Video views, Story reach
Related Dashboards
View all dashboards