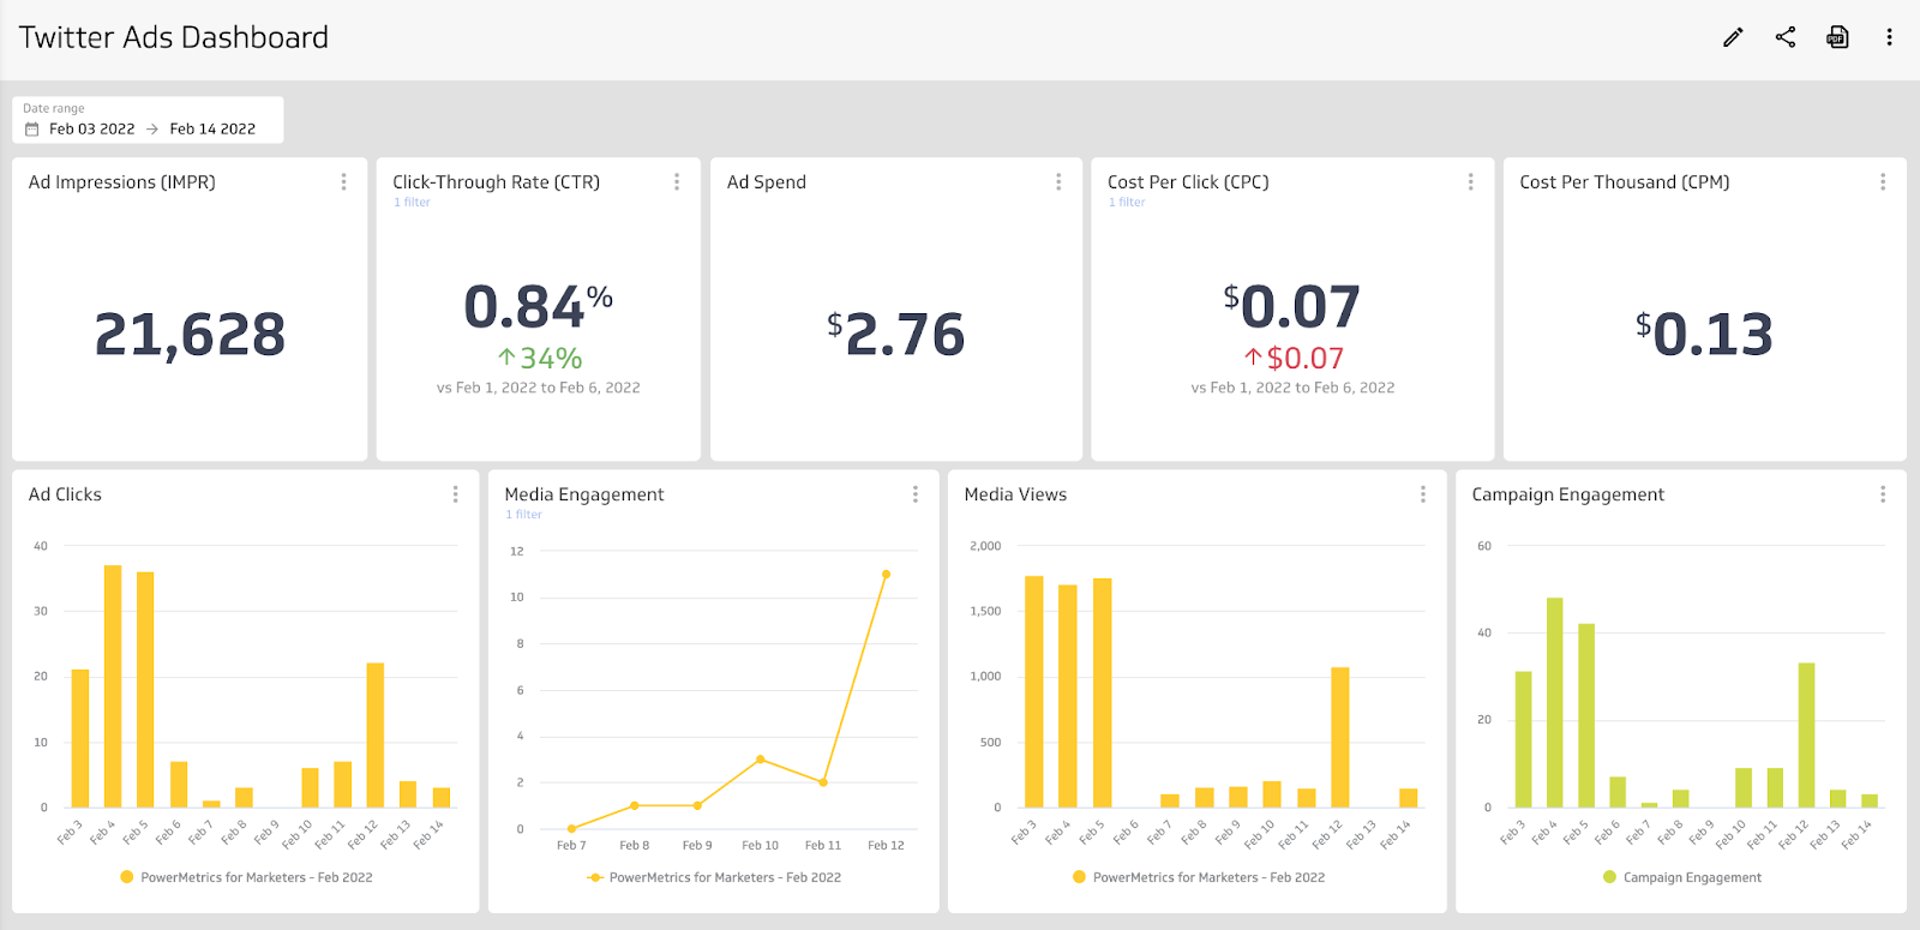
X (Twitter) Ads Dashboard
Track your paid social media performance, from ad spend to engagement, all in one place.
What is an X (Twitter) Ads dashboard?
An X (Twitter) Ads dashboard monitors the key metrics and KPIs for your paid social media marketing. When you place your X Ads metrics on a dashboard, you can easily understand how your ads are performing, whether you're reaching your target audience, and the level of engagement with your content.
When you track your X Ads on a dashboard, you can answer important questions like:
How many people are my ads reaching?
How does my audience engage with my ads? Are they clicking a link or converting?
What is my ad spend?
An X Ads dashboard gives you the insight you need to determine if X is a successful channel for your paid advertising and whether it's helping you convert users into customers.
What metrics should you include on an X Ads dashboard?
Before building your dashboard, identify the metrics that connect most directly to your campaign goals. The following KPIs are a strong starting point.
Ad Clicks
Ad Clicks counts the number of times users have clicked on a digital advertisement to reach an online property.
Ad Spend
Ad Spend is the amount of money spent on specific ad variations within a campaign or ad set.
Click-Through Rate (CTR)
Click-Through Rate (CTR) is the percentage of impressions that result in a click on your link.
Cost Per Thousand (CPM)
Cost Per Thousand (CPM), also called Cost Per Mille, describes the price of 1,000 advertisement impressions on an advertiser's webpage.
Post Likes
Post Likes measures the popularity of social media content across platforms.
Content Engagement
Content Engagement measures all engagements resulting from content generated in a social media account.
What visualizations work best on an X Ads dashboard?
Building an X Ads dashboard gives you insight into your ad spend, attributed engagement, and the growth of your paid marketing campaigns. Most X Ads metrics can be segmented by date and time, ad placement, or campaign, so choosing the right visualization matters.
Bar charts and line charts
Temporal data visualizations, like bar or line charts, are among the most familiar chart types. Both use an x- and y-axis so you can compare values over a period of time.
For example, if you want to track ad clicks each day, a bar or line chart lets you see daily click volume at a glance. You can quickly identify trends or flag performance drops before they become a problem.
Summary charts
Summary charts display one numeric value and often include a comparison value. On an X Ads dashboard, a summary chart works well for total ad spend or click-through rate. Pairing a summary chart with a numeric or percentage comparison makes it easy to spot positive or negative growth.
Benefits of an X Ads dashboard
Putting all of your X Ads performance and engagement metrics on a dashboard gives you a single source of truth for your ad data. With Klipfolio Klips, you can adjust date ranges, choose the right visualization for each metric, and share the dashboard with your team. Klips lets you add users and set granular access controls so everyone stays aligned on social media performance, without the back-and-forth of manual reporting.
Dashboard inspiration for your X Ads
The right dashboard depends on what you're trying to answer. Here are three focused approaches you can build in Klips.
Track overall campaign performance
Build a dashboard that gives you a complete picture of how your campaigns are performing. This dashboard will help you answer:
How many people saw my ads over a specific time period?
What is the overall ad spend and cost per click?
What is the click-through rate of my ads?
How are people engaging with my ads?
Tracking these metrics helps you adjust your paid social strategy based on real results, not assumptions.
Track engagement with your X Ads content
Understanding how users interact with your ads is essential for improving creative and targeting. An engagement-focused dashboard will help you answer:
Are users clicking through my ads to reach my website?
How many people did my ads reach?
What is the total number of engagements across my ads?
You can also segment these metrics by individual ad, so you can see which content drives stronger engagement and identify areas for adjustment.
Track advertising spend
Budget accountability is a core part of any paid social strategy. An ad spend dashboard will help you answer:
How much money are we spending on advertising?
What is our return on marketing investment?
What is our cost-per-click?
Tracking spend metrics keeps your campaigns within budget and gives you the data you need to request a budget increase or reallocate spend to higher-performing ads.
What does success look like with an X Ads dashboard?
A well-built X Ads dashboard is a reporting tool your whole team can use. It surfaces campaign performance and engagement data in a format everyone can understand, with clear visualizations that highlight key insights without requiring manual interpretation.
X Ads is one part of your broader paid social strategy. The data on your dashboard helps you identify trends in audience behaviour, evaluate what's working, and make informed adjustments. By centralizing this data in Klips, you move away from scattered reports and give your team a shared view of performance.
At a glance
Focus Area
Paid social media advertising performance and budget tracking
Metrics List
Ad Clicks, Ad Spend, Click-Through Rate (CTR), Cost Per Thousand (CPM), Post Likes, Content Engagement
Related Dashboards
View all dashboards