

Summary - Web traffic sources tell you where your visitors come from and how well each channel is working for your business. This post defines the web traffic sources metric, explains the difference between source and medium in GA4, and walks through six key signals to analyze, including goal completion rates, bounce rate, and time on site. It's part of a series on essential digital marketing KPIs for marketers who want to act on data in real time, not just review it monthly.
Web traffic sources tell you where your visitors come from and how well each channel is actually working for your business. If you know which sources drive real results, not just clicks, you can make faster decisions about where to spend your time and budget.
This post is part of a series defining essential digital marketing KPIs for marketers who want to move beyond monthly reports and start using data to act in real time.
What are web traffic sources?
Web traffic sources are the channels that bring visitors to your website. Tracking them tells you which efforts are paying off, which need attention, and where your next visitor is likely to come from.
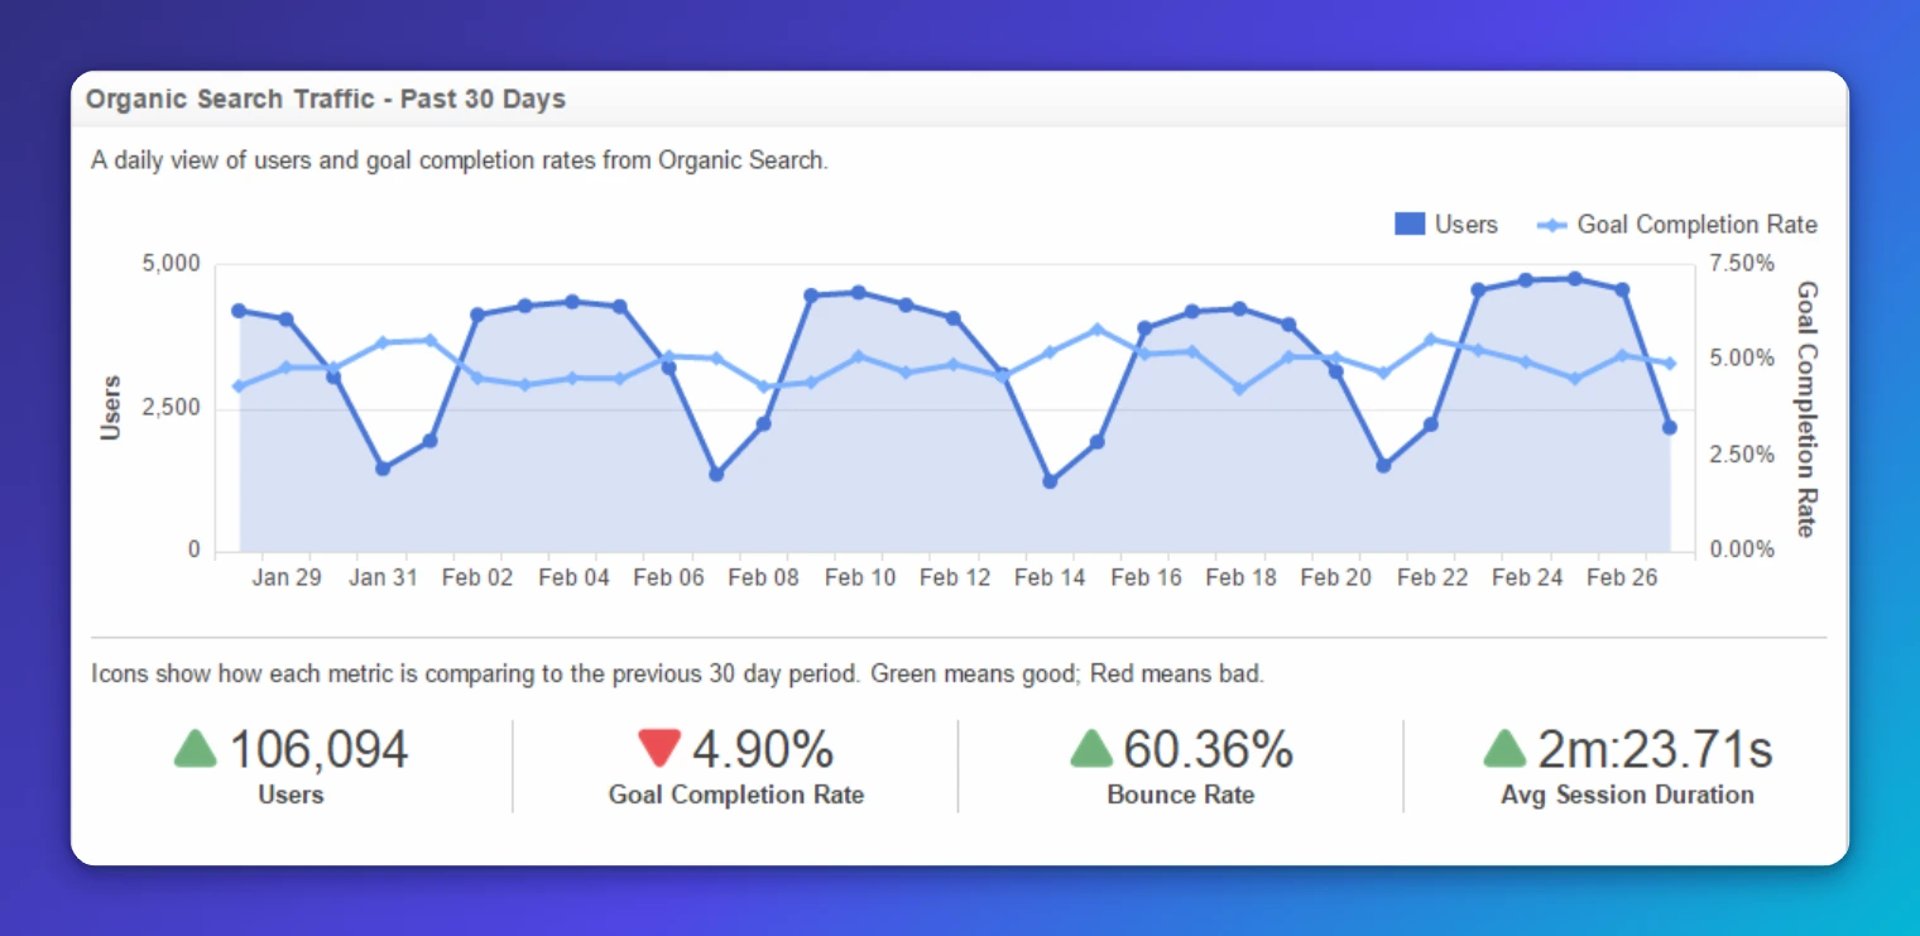
The web traffic sources metric isn't a single number. It's a collection of signals that, together, give you a clear picture of your marketing performance. Take SEO: by looking at metrics tied to organic visitors, you can see goal completion rates, time on site, and bounce rates, and quickly assess whether your content is doing its job. Explore the key metrics to add to your SEO dashboard.
Sources and mediums: what's the difference?
"Traffic sources" is often used as a catch-all phrase, but Google Analytics (GA4) draws a sharper distinction between two related terms: source and medium.
Source is the specific origin of a visitor. Examples:
facebook.com
newsletter
Medium is the method or channel type. Examples:
organic
referral
cpc
More detail on how these work: Traffic source dimensions.
The pairing matters because the same source can deliver traffic through different mediums, and those audiences behave very differently. Here are a few examples:
| Source | Medium | What happened? |
|---|---|---|
| X (platform) | Referral | Someone clicked a link on X that referred them to your website |
| X (platform) | Advertising | Someone clicked a paid link on X that directed them to your website |
| Organic search | Someone searched a keyword on Google and found your website. See also: SEO keyword ranking | |
| CPC | Someone searched on Google, saw a keyword ad, clicked it, and landed on your website | |
| None | Direct | Someone typed your URL directly into their browser |
Tracking traffic sources in GA4
GA4 is your starting point for this data. It automatically groups visitors into channel buckets so you can analyze behaviour without manual setup.
If you haven't connected GA4 yet, start here: Getting started with Google Analytics. If you don't have account access, ask your website admin. There's no substitute for working directly with the data.
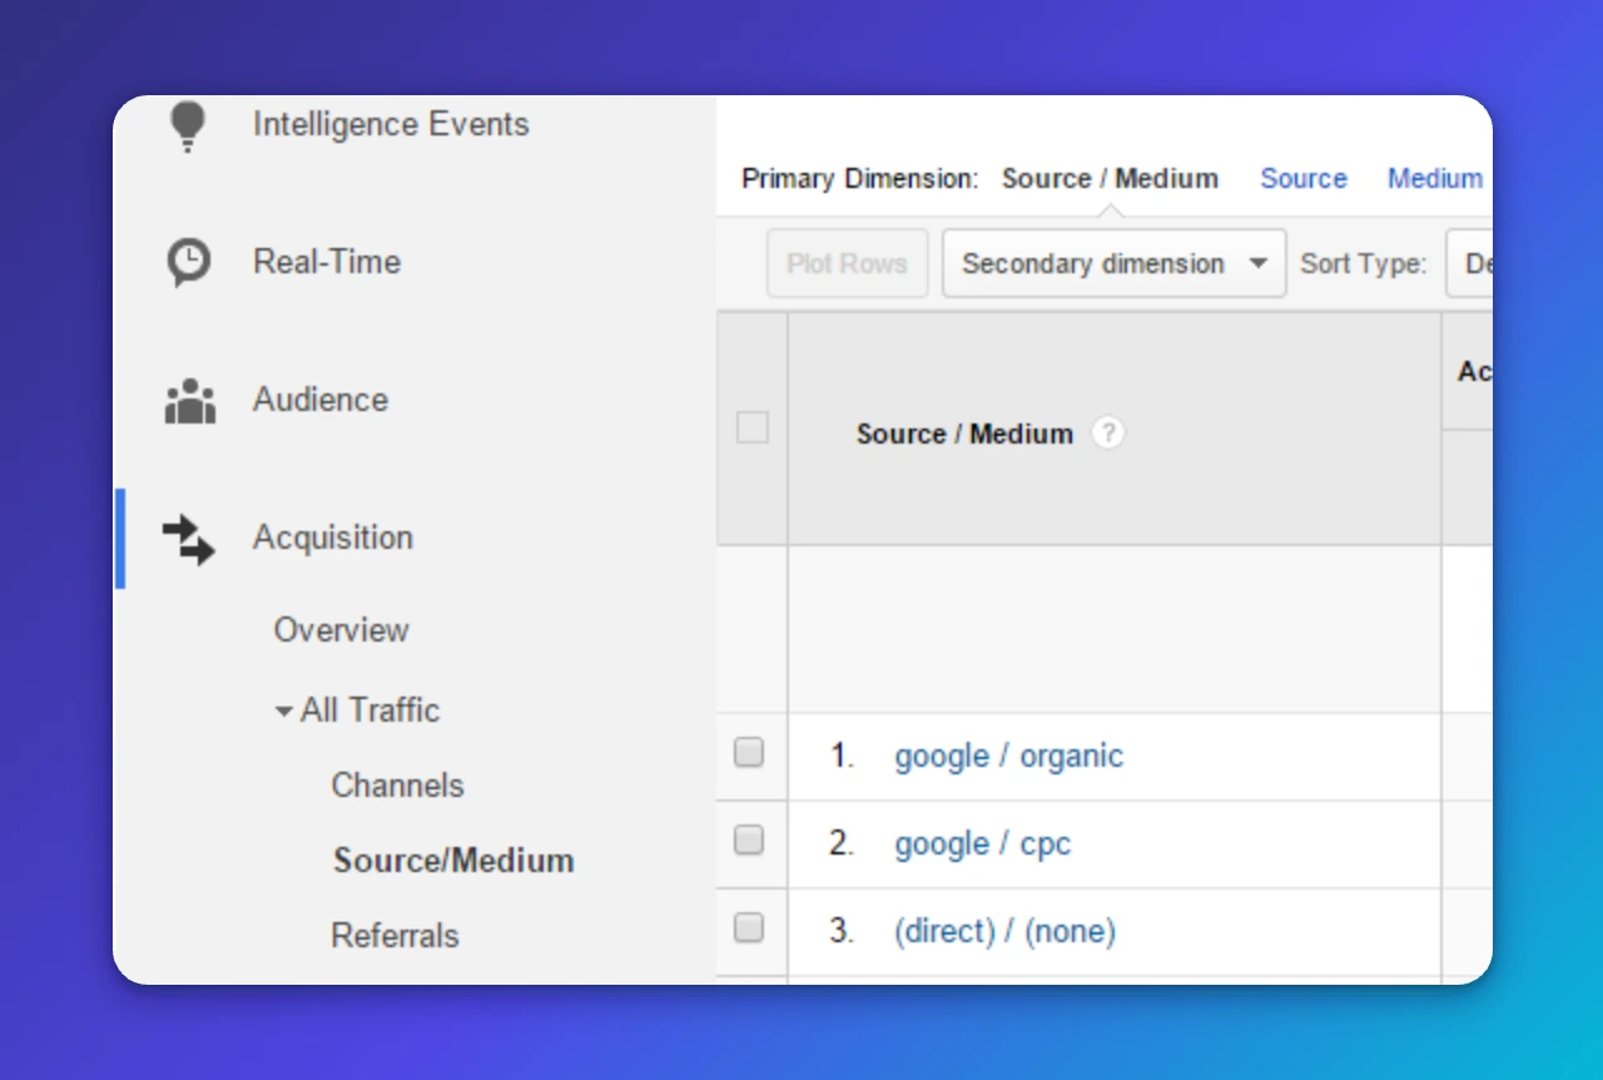
Inside GA4, go to Reports > Acquisition > Traffic acquisition. This report shows acquisition, engagement, and conversion metrics broken down by channel. Start with the default view before adding segments or secondary dimensions.
6 things to look for when analyzing traffic sources
1. Goal completion rates
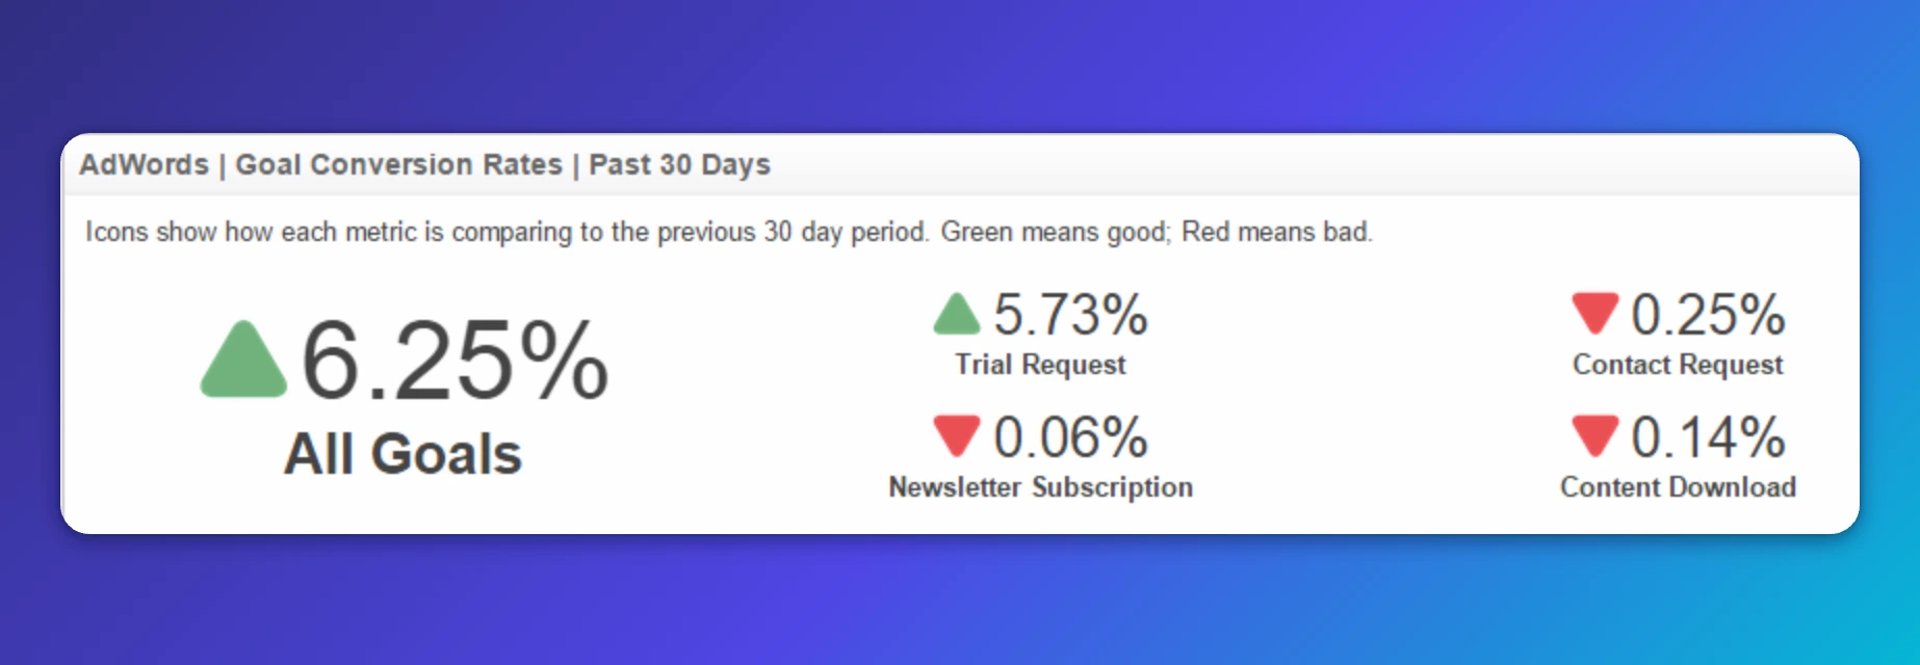
Goal tracking maps user behaviour to specific marketing objectives, things like contact form submissions, purchases, or downloads. Completion rates tell you whether a traffic source is bringing in people who actually do something, or just people who show up and leave. Watch this closely for paid channels like search ads or display. High spend with low completion rates is a signal worth acting on.
2. Sessions
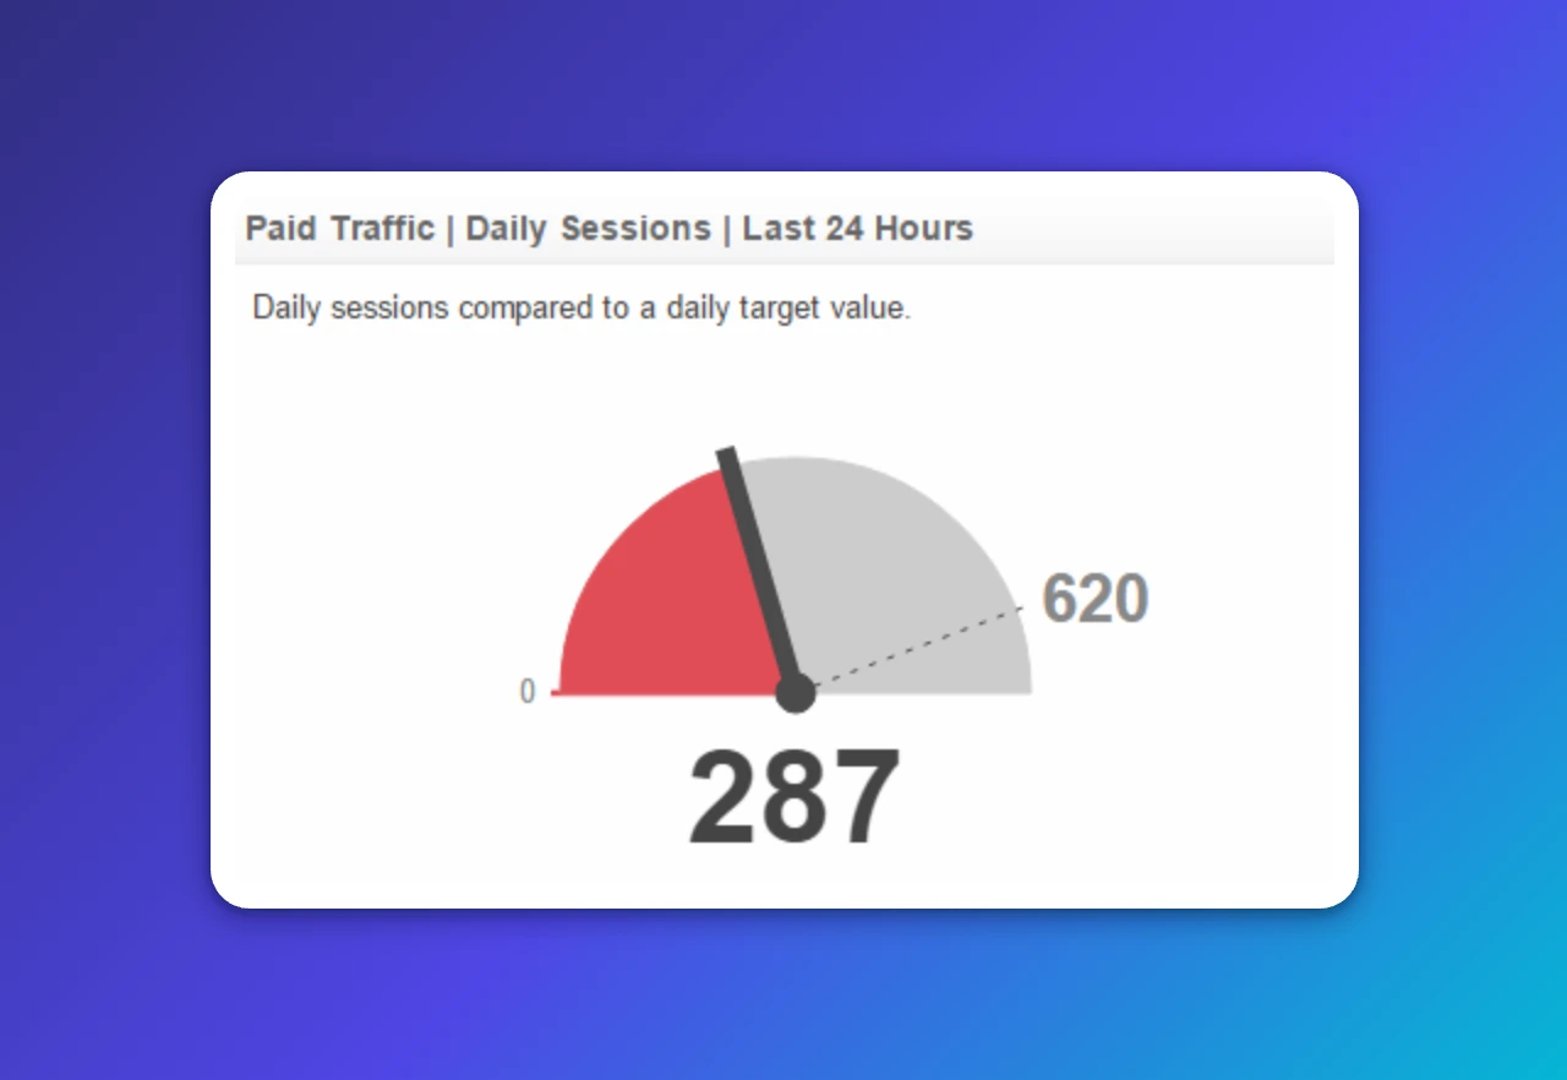
Sessions show the total number of visits from each channel. In GA4, this number shifts depending on how you define engagement in the dropdown. If you set engagement as "4 or more pageviews," only sessions meeting that threshold appear in the engaged row. Keep your definition consistent so comparisons stay meaningful.
3. Bounce rate
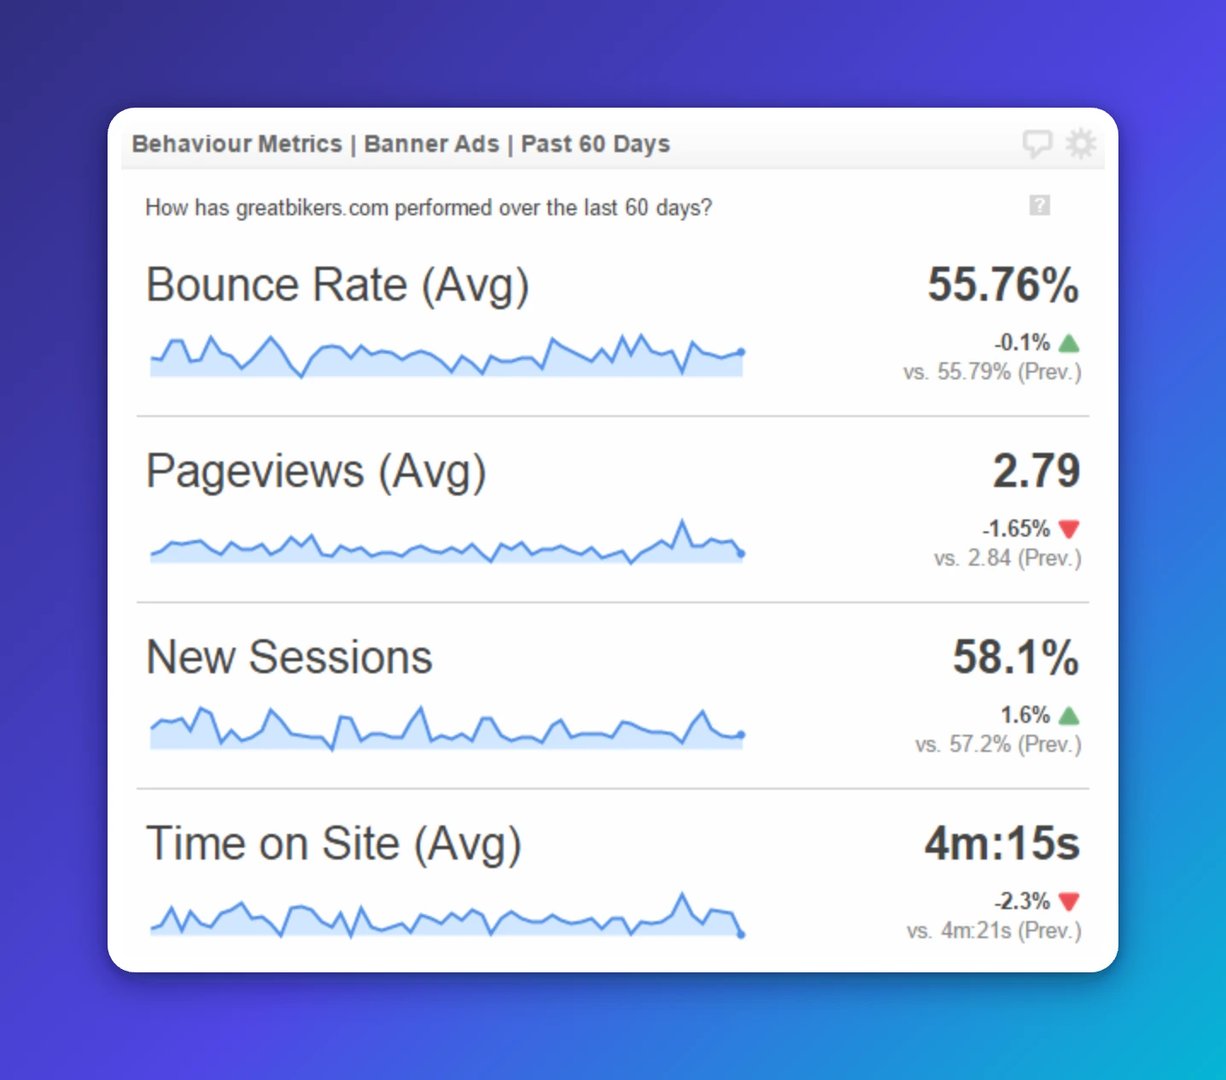
Bounce rate is a first-impression metric. A high rate means visitors landed, saw something that didn't match what they expected, and left. Some channels naturally produce higher bounce rates, so compare across sources and set a baseline for what's acceptable given the campaign type. A spike in bounce rate from a paid channel is worth investigating immediately.
4. Pages per session
This metric matters most for unpaid sources like organic search traffic and referral traffic. Paid traffic often lands on focused conversion pages with few outbound links by design. Organic and referral visitors, arriving through content, should ideally explore more of your site. Low pages per session from organic traffic can point to a content relevance problem.
5. Percentage of new sessions
Growth requires new visitors. Channels like email and referral tend to bring back people who already know you. Paid channels and organic search typically fill the top of the funnel with first-time visitors. Tracking the split helps you understand whether a channel is expanding your reach or reinforcing it.
6. Time on site
Time on site tells you whether your content is holding attention. For paid campaigns especially, low time on site alongside low goal completion rates is a clear signal that the audience, the message, or the landing page isn't aligned.
How to put traffic source data to work
Most marketing teams look at traffic sources once a month during performance reviews. That's useful, but it leaves a lot on the table.
The real value comes from monitoring this data continuously. When something shifts, you find out right away, not three weeks later. Here's a real example: a paid campaign launched, and within 24 hours, the traffic quality looked poor. A monitoring dashboard surfaced the issue immediately. The team contacted the advertiser, shifted inventory, and saw improved results within another 24 hours.
That kind of response is only possible when the data is visible to everyone who needs it, not just the person who runs the GA4 report. A well-built dashboard puts the right numbers in front of your CMO, your campaign manager, and anyone else accountable for results, without requiring them to dig through analytics tools themselves. Instead of waiting for someone to pull a number, the number is already there.
Connecting Klipfolio to GA4 gives your team a live view of traffic performance across every channel. Explore the Google Analytics dashboard to get started.
Tracking organizations marketing KPIs this way means your team spends less time explaining what happened and more time deciding what to do next.
Useful resources
Related Articles

5 tips to understand (and organize) your restaurant data
By Saleem Khatri — June 9th, 2026
6 dashboards I use daily to run my SaaS company
By Allan Wille, Co-Founder — April 10th, 2026
Business Metrics vs. KPIs: What’s the Difference?
By Jonathan Taylor — March 13th, 2026