

Summary - Reliable SaaS growth depends on tracking the right financial metrics consistently. This expert-informed list covers 22 key metrics for SaaS finance leaders, from Annual Contract Value and Burn Multiple to the Rule of 40 and Weighted ACV, with plain-English definitions and context for each. Use a SaaS dashboard to centralize these metrics, keep definitions consistent, and share a single version of the truth across your team.
SaaS growth targets are ambitious: new markets, funding rounds, bell-ringing moments. Hitting those goals takes disciplined execution grounded in clear, reliable numbers.
If you lead finance at a SaaS company, you translate strategy into figures that stand up to scrutiny. Without a tight grip on the right metrics, investor conversations stall and planning wobbles. The numbers also need to mean the same thing to everyone in the room, not just to the person who built the spreadsheet.
Metrics mark the milestones in your company's story. The challenge is knowing which ones matter for your stage and model, then trusting them enough to act on them.
This expert-informed list covers the most important financial metrics for SaaS finance leaders. Use a SaaS dashboard to centralize these metrics, keep definitions consistent, and share a single version of the truth across the team.
Annual Contract Value (ACV)
Burn Multiple
Customer Acquisition Cost Ratio (CAC Ratio)
Customer Concentration
Deviation from Target Churn Rate
Gross MRR Churn Rate
Gross Revenue Retention Rate (GRR)
Hype Factor
Logo Churn
MRR Growth Rate
Net Annual Recurring Revenue Added (Net ARR Added)
Payment Acceptance
Propensity to Renew
Reactivation MRR
SaaS Magic Number
SaaS Quick Ratio
The Rule of 40
Total Addressable Market (TAM)
Weighted ACV (WACV)
Annual Contract Value (ACV)
Expert contributor: Lauren Thibodeau
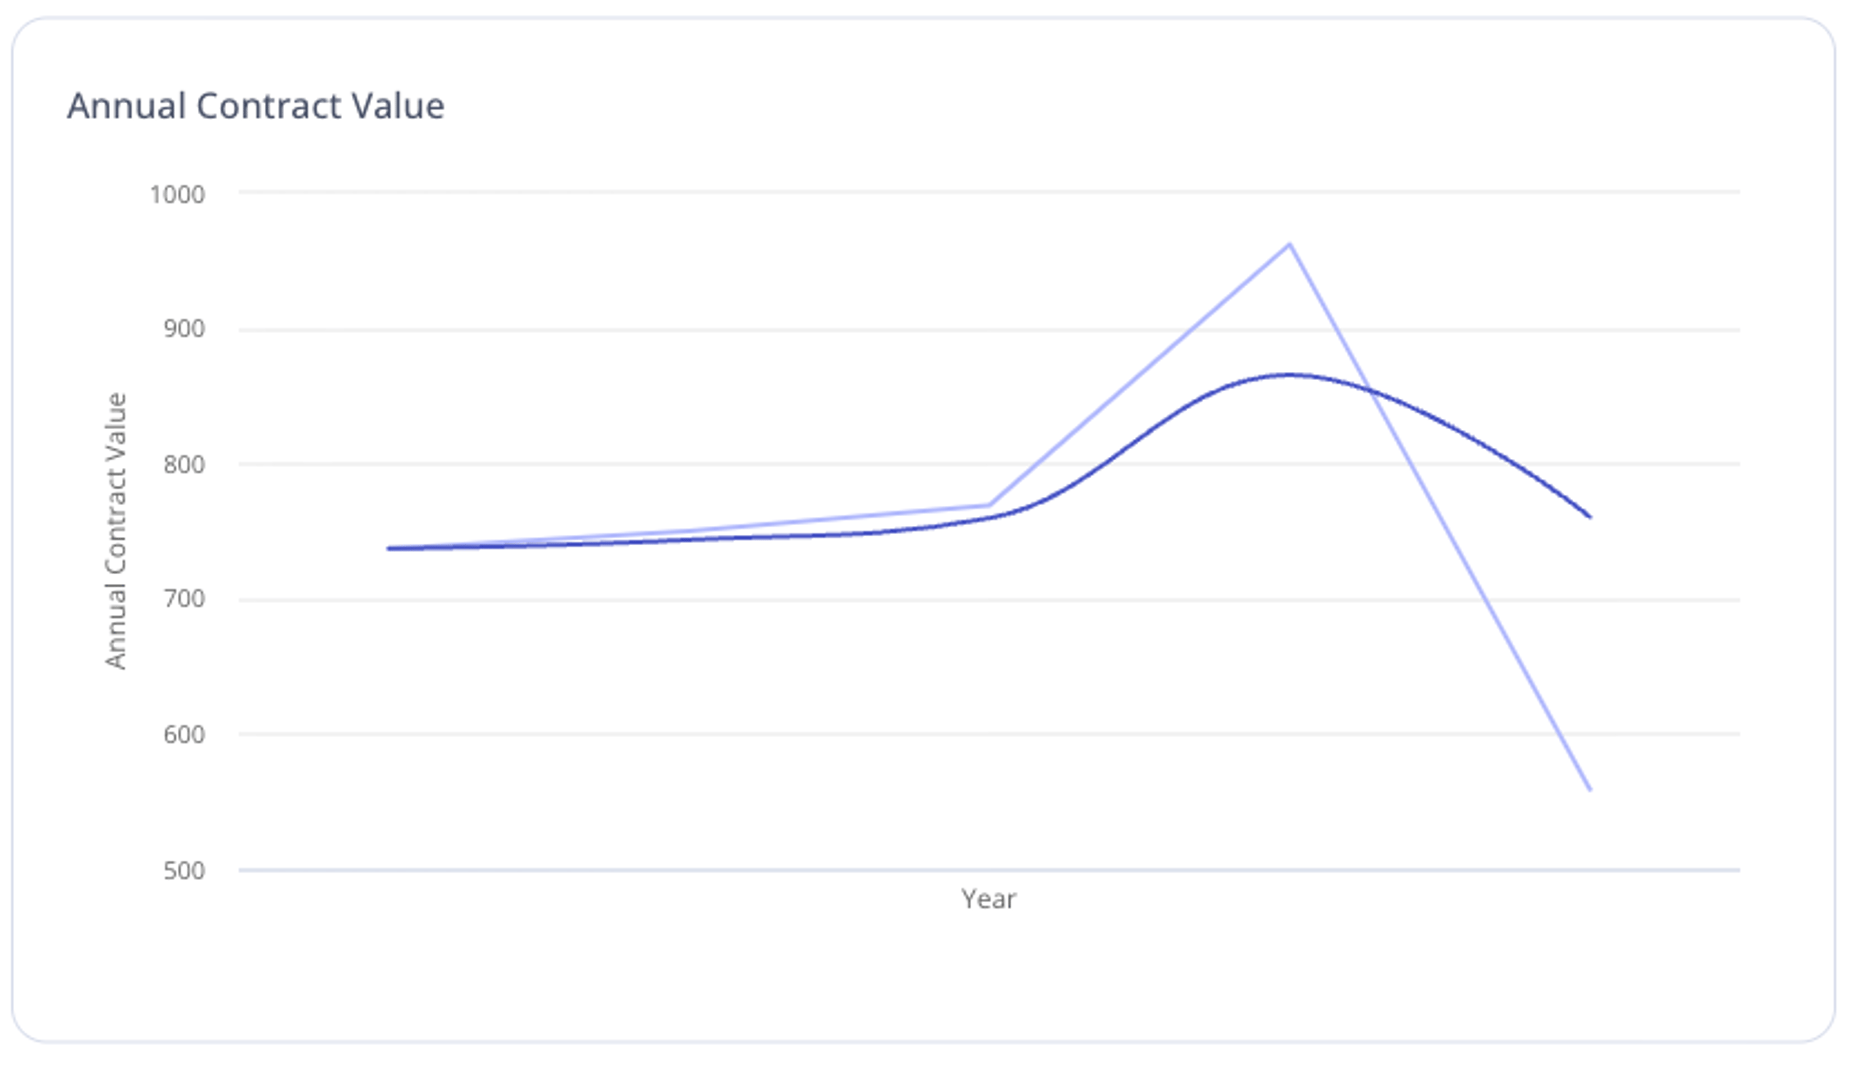
Annual Contract Value (ACV) is the dollar amount an average customer contract is worth to your company in one year. Definitions vary: some teams include one-time fees like setup or training; others don't. What matters most is consistency. Track ACV the same way each period so the number means the same thing every time someone looks at it, whether that's you, a board member, or a potential investor.
Burn Multiple
Expert contributor: David Sacks
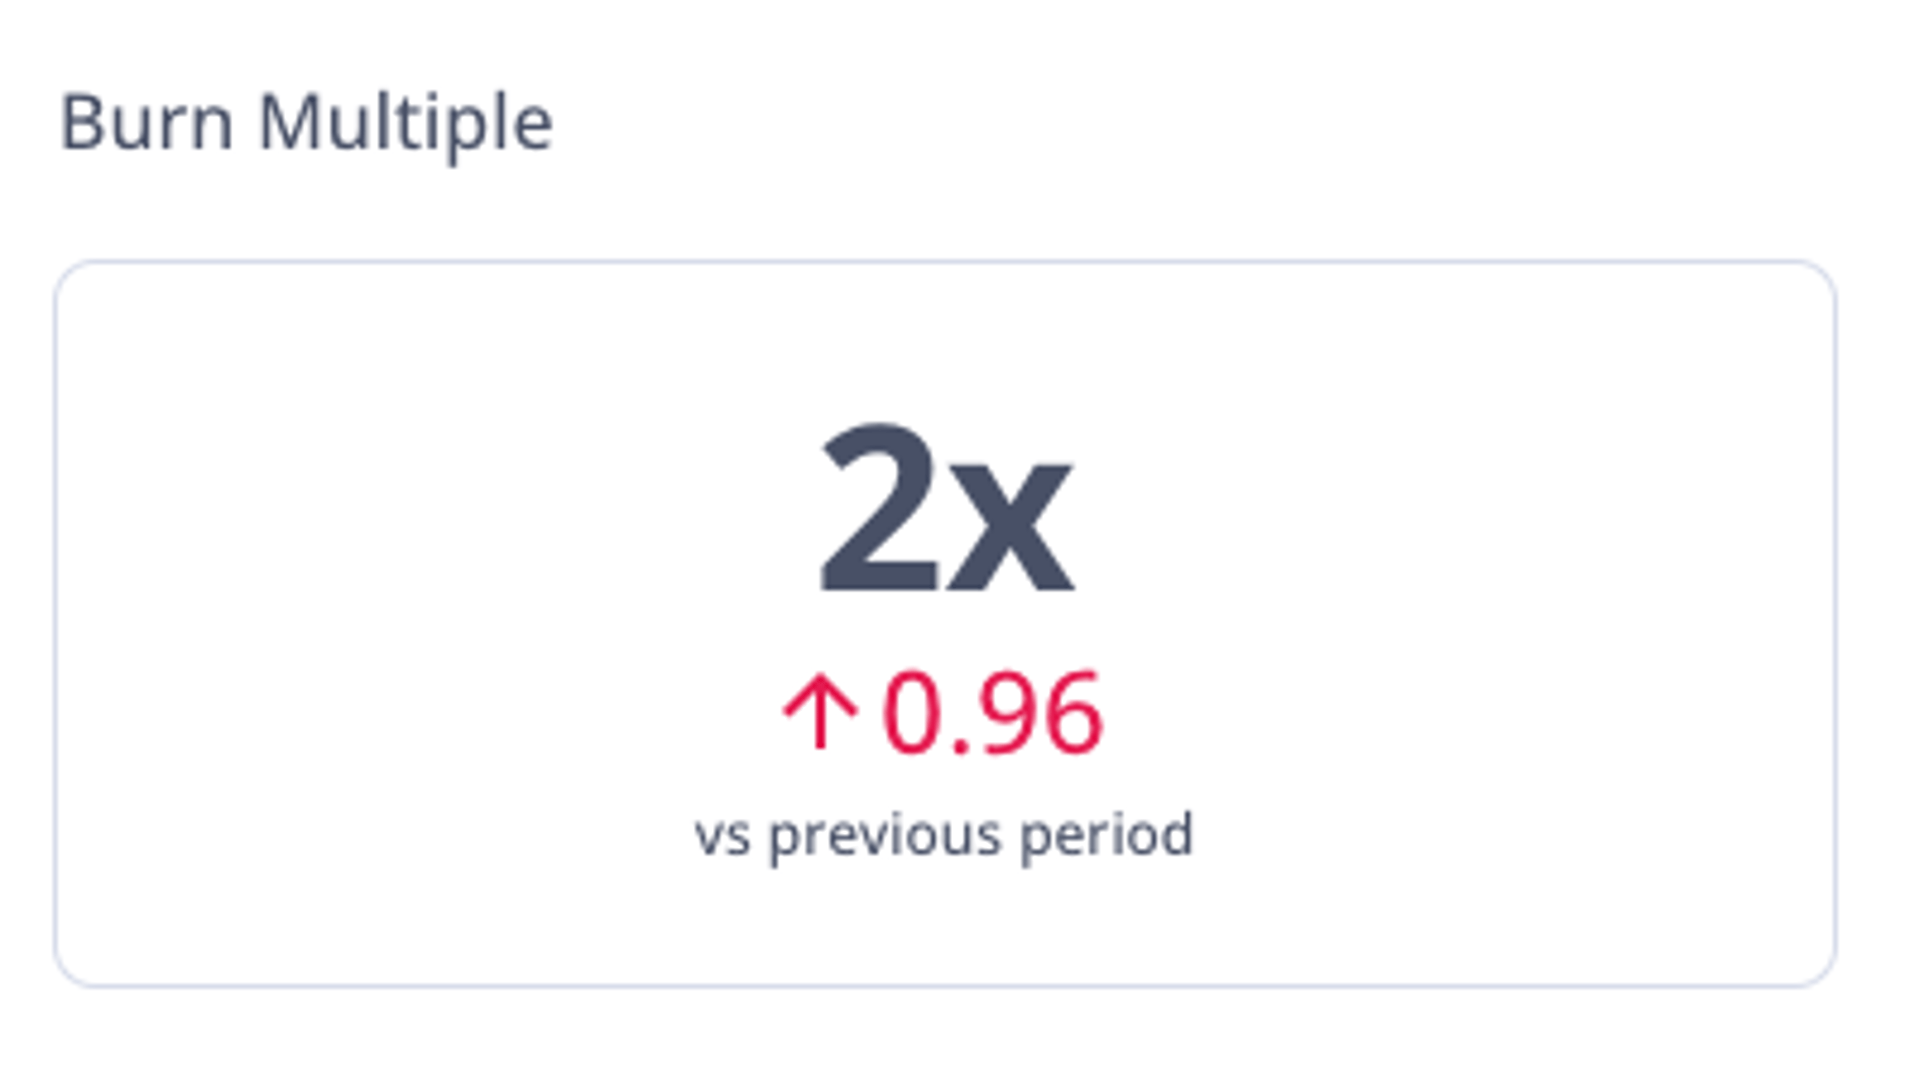
Burn Multiple shows how much cash a startup burns to add each incremental dollar of ARR. Lower is better. It tells you whether growth is coming at a sustainable cost or whether the company is spending its way to a number that won't hold up under pressure.
Customer Acquisition Cost (CAC)
Expert contributor: Mandy Leavell
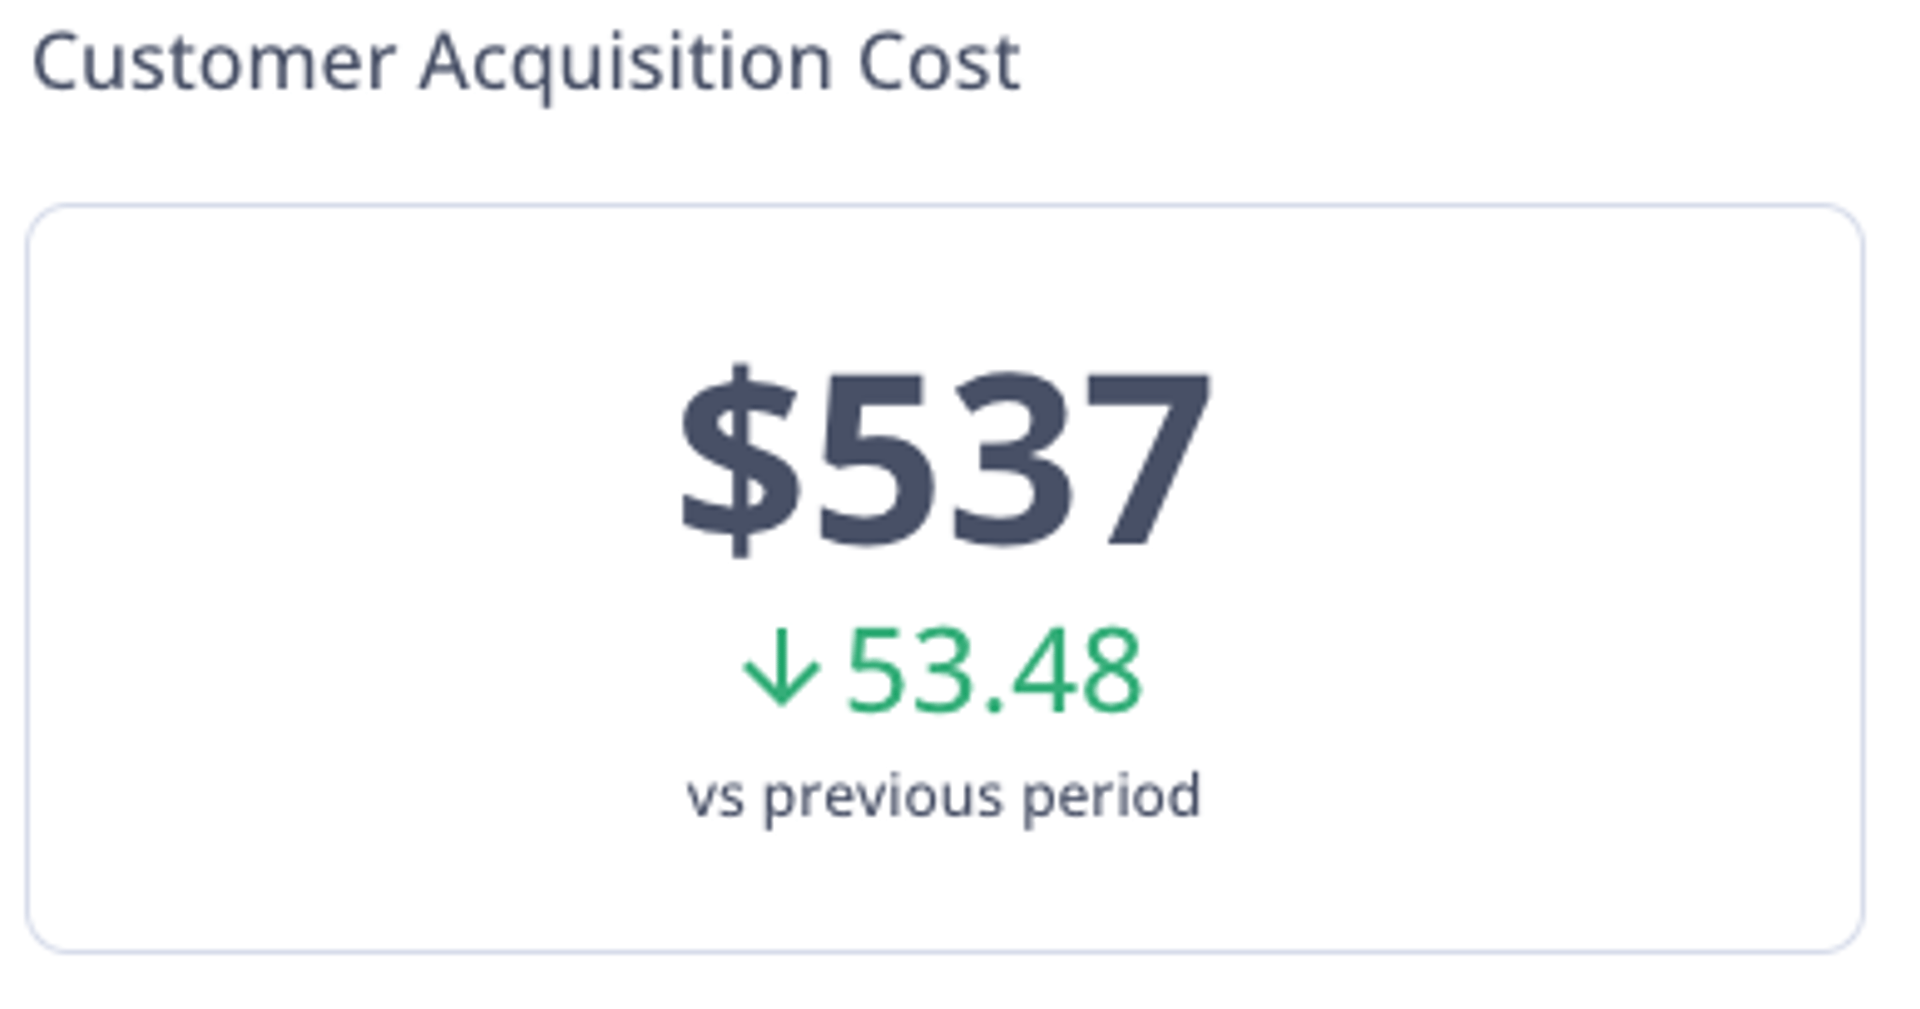
Customer Acquisition Cost (CAC) is the cost to acquire one new customer. Include fully-loaded sales and marketing costs divided by the number of new customers in the period. A reliable CAC figure gives you the confidence to know whether growth is actually profitable, not just fast.
Customer Acquisition Cost Ratio (CAC Ratio)
Expert contributor: Vinny Prajka
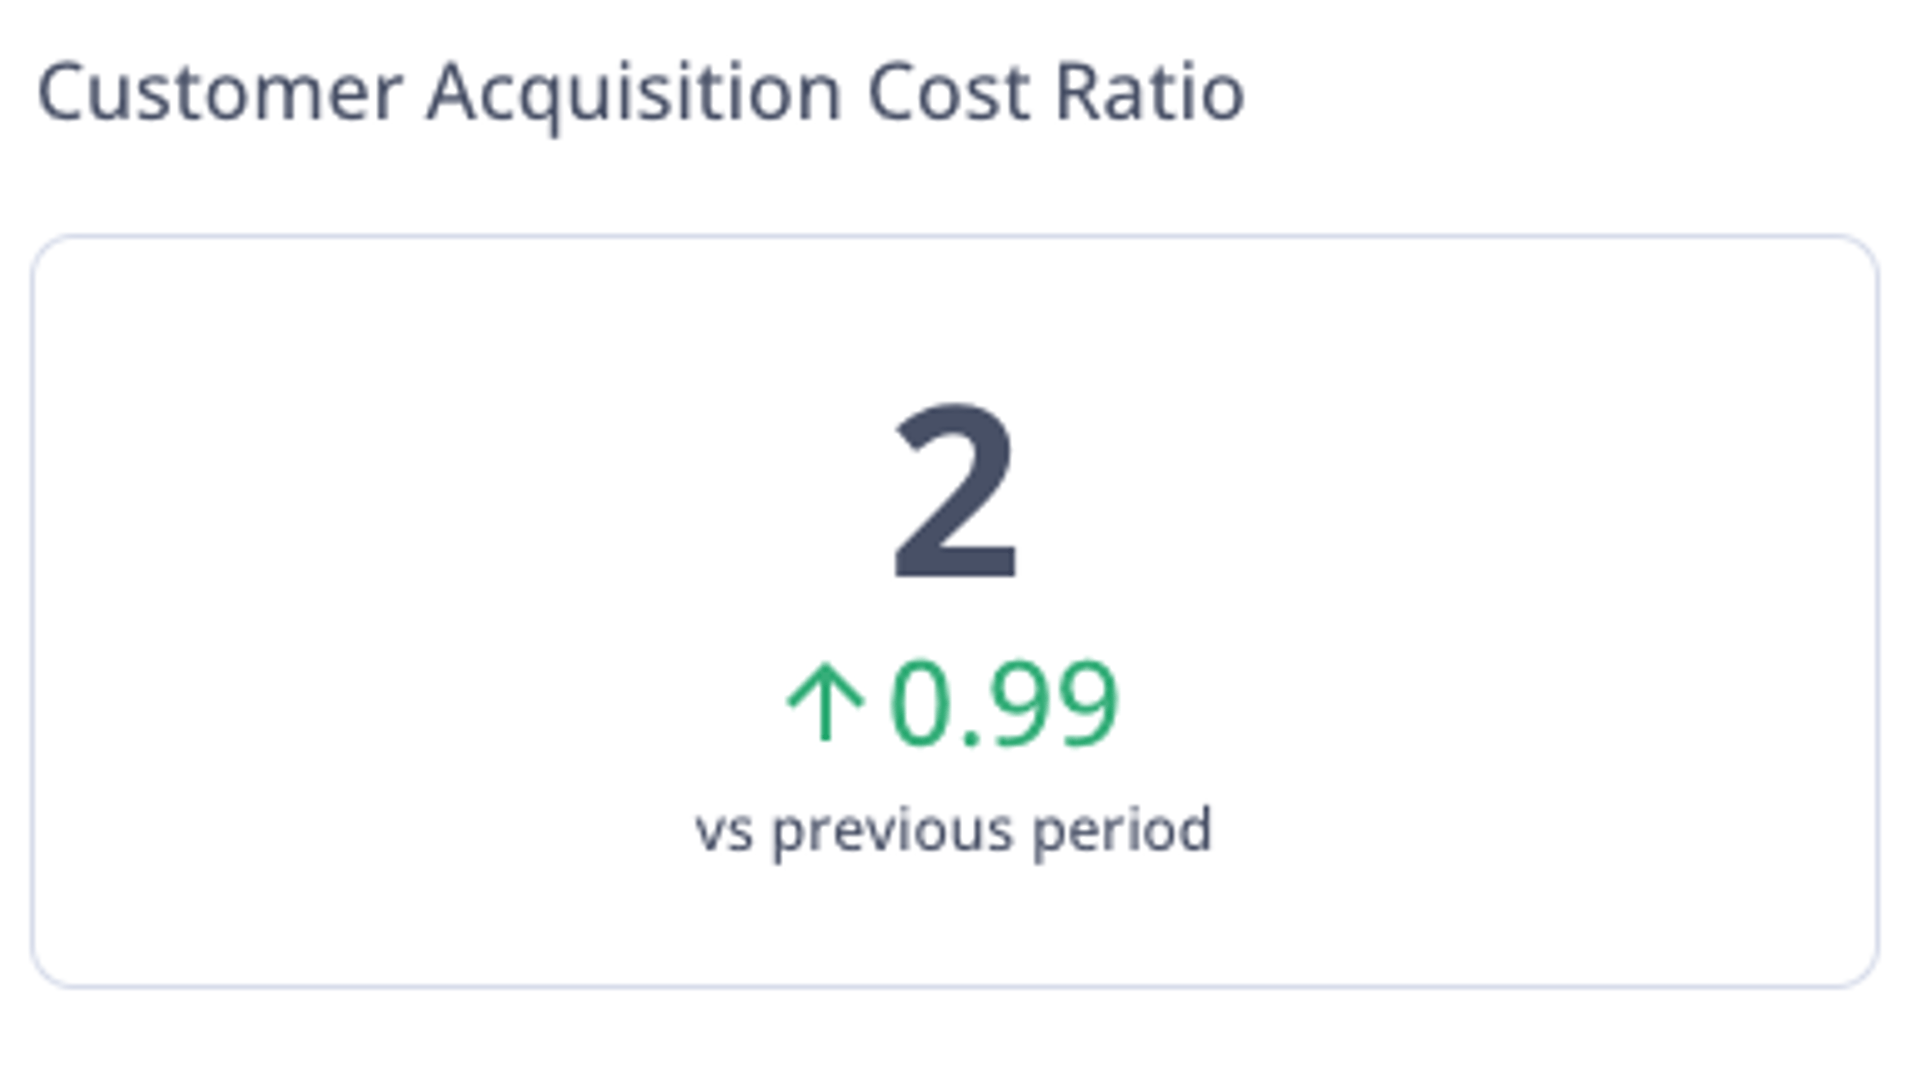
CAC Ratio measures sales and marketing efficiency: for each dollar invested, how much new subscription contract value is generated, adjusted for gross margin. Your target depends on market context, growth goals, and delivery efficiency. It's a useful check on whether go-to-market spend is pulling its weight.
Customer Concentration
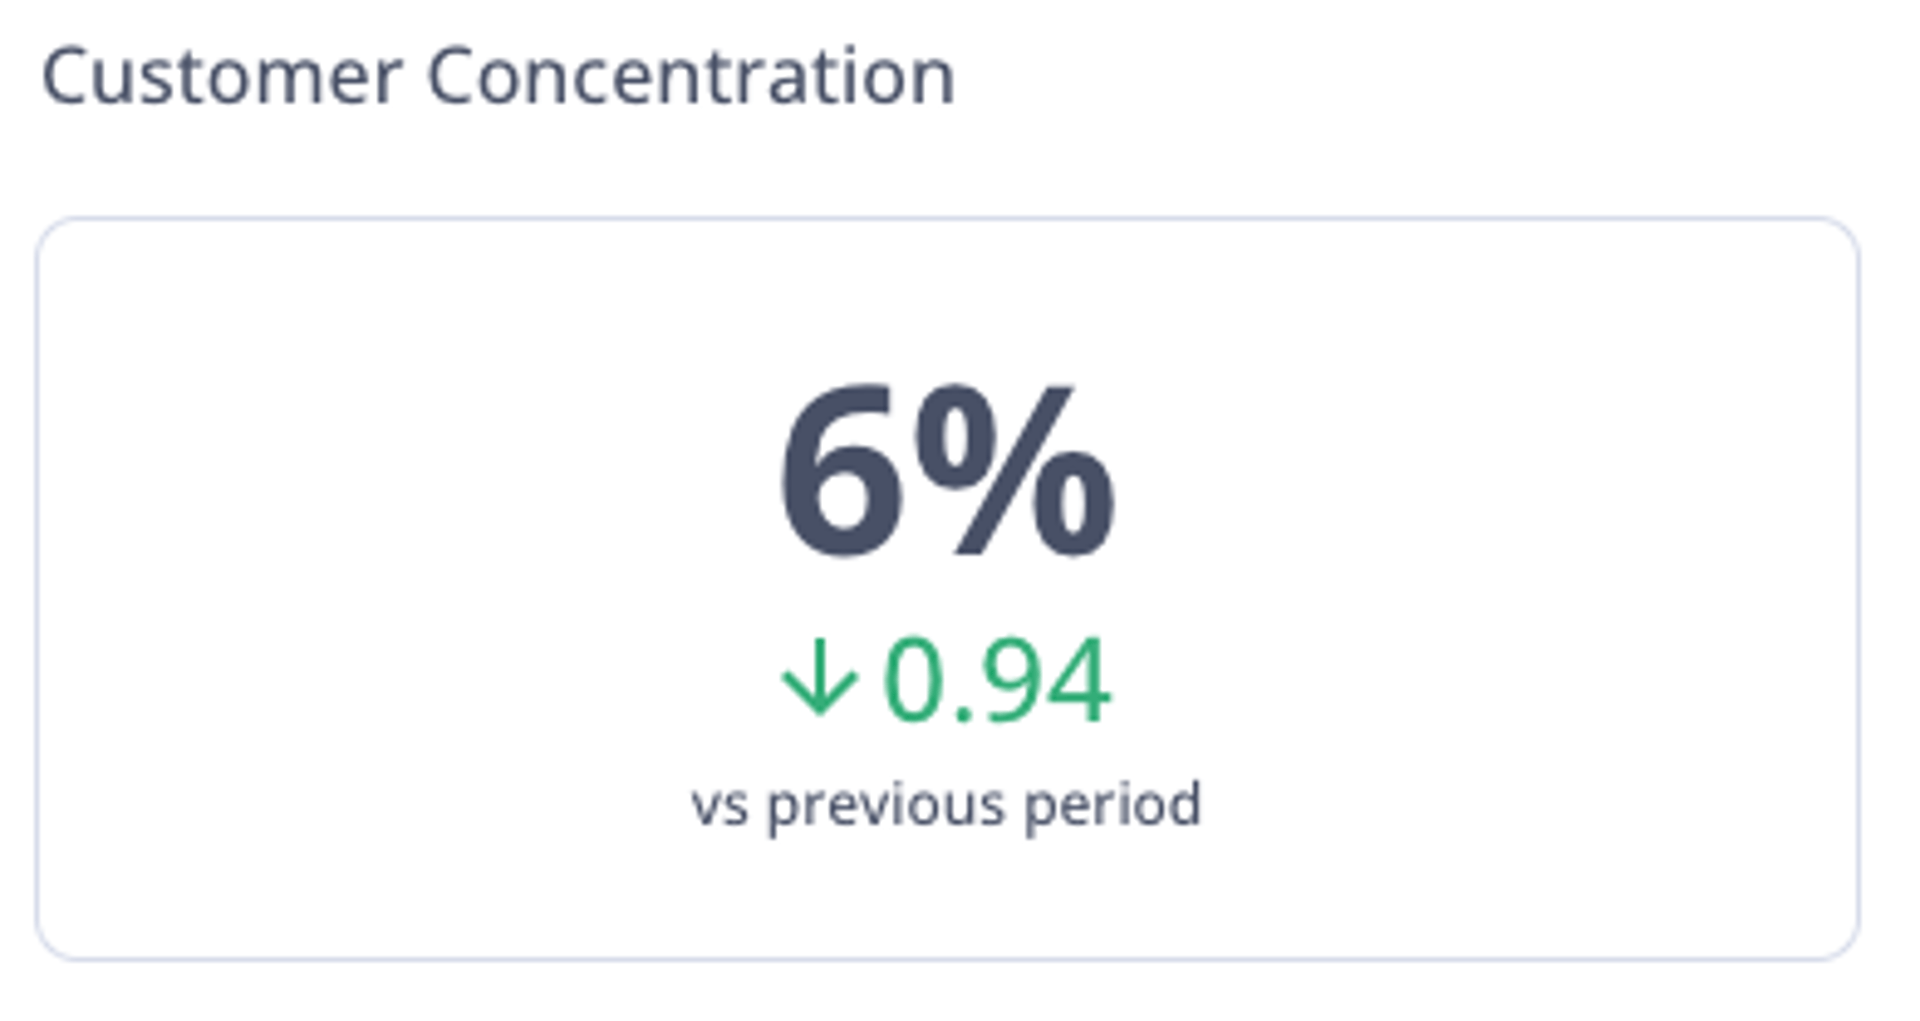
Customer Concentration, or Customer Revenue Concentration, is the share of total revenue generated by your highest-paying client or a group of top-paying clients. High concentration increases risk if a key account is lost. Some teams value the focus and deeper relationships that come with larger accounts, but the trade-offs include demanding requirements and revenue volatility. Knowing this number before an investor asks is better than calculating it in the room.
Customer Lifetime Value (LTV)
Expert contributor: Pablo Srugo
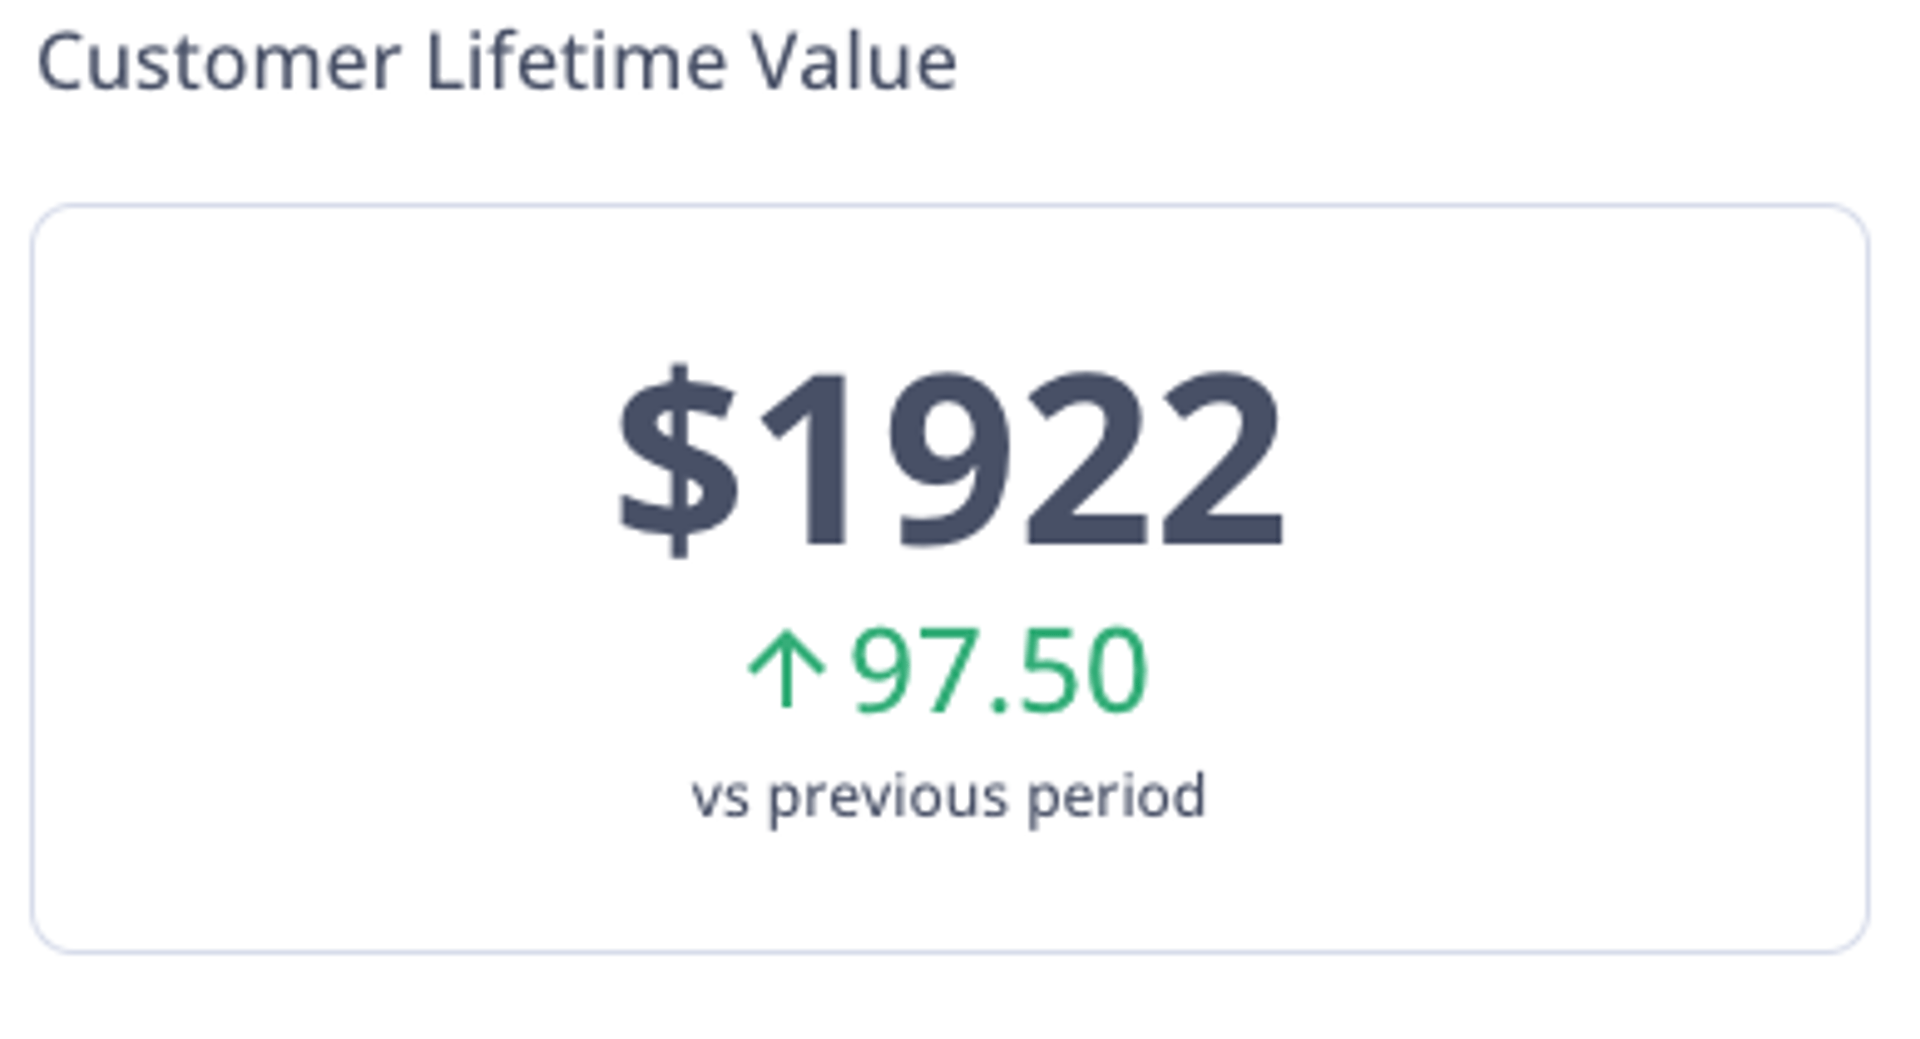
Customer Lifetime Value (LTV) estimates total revenue from a typical customer over their relationship with your company. Use it to identify high-value segments and to guide acquisition and retention spend. When LTV is reliable, you can make faster decisions about where to invest without second-guessing the math.
Deviation from Target Churn Rate
Expert contributor: Douglas Alves
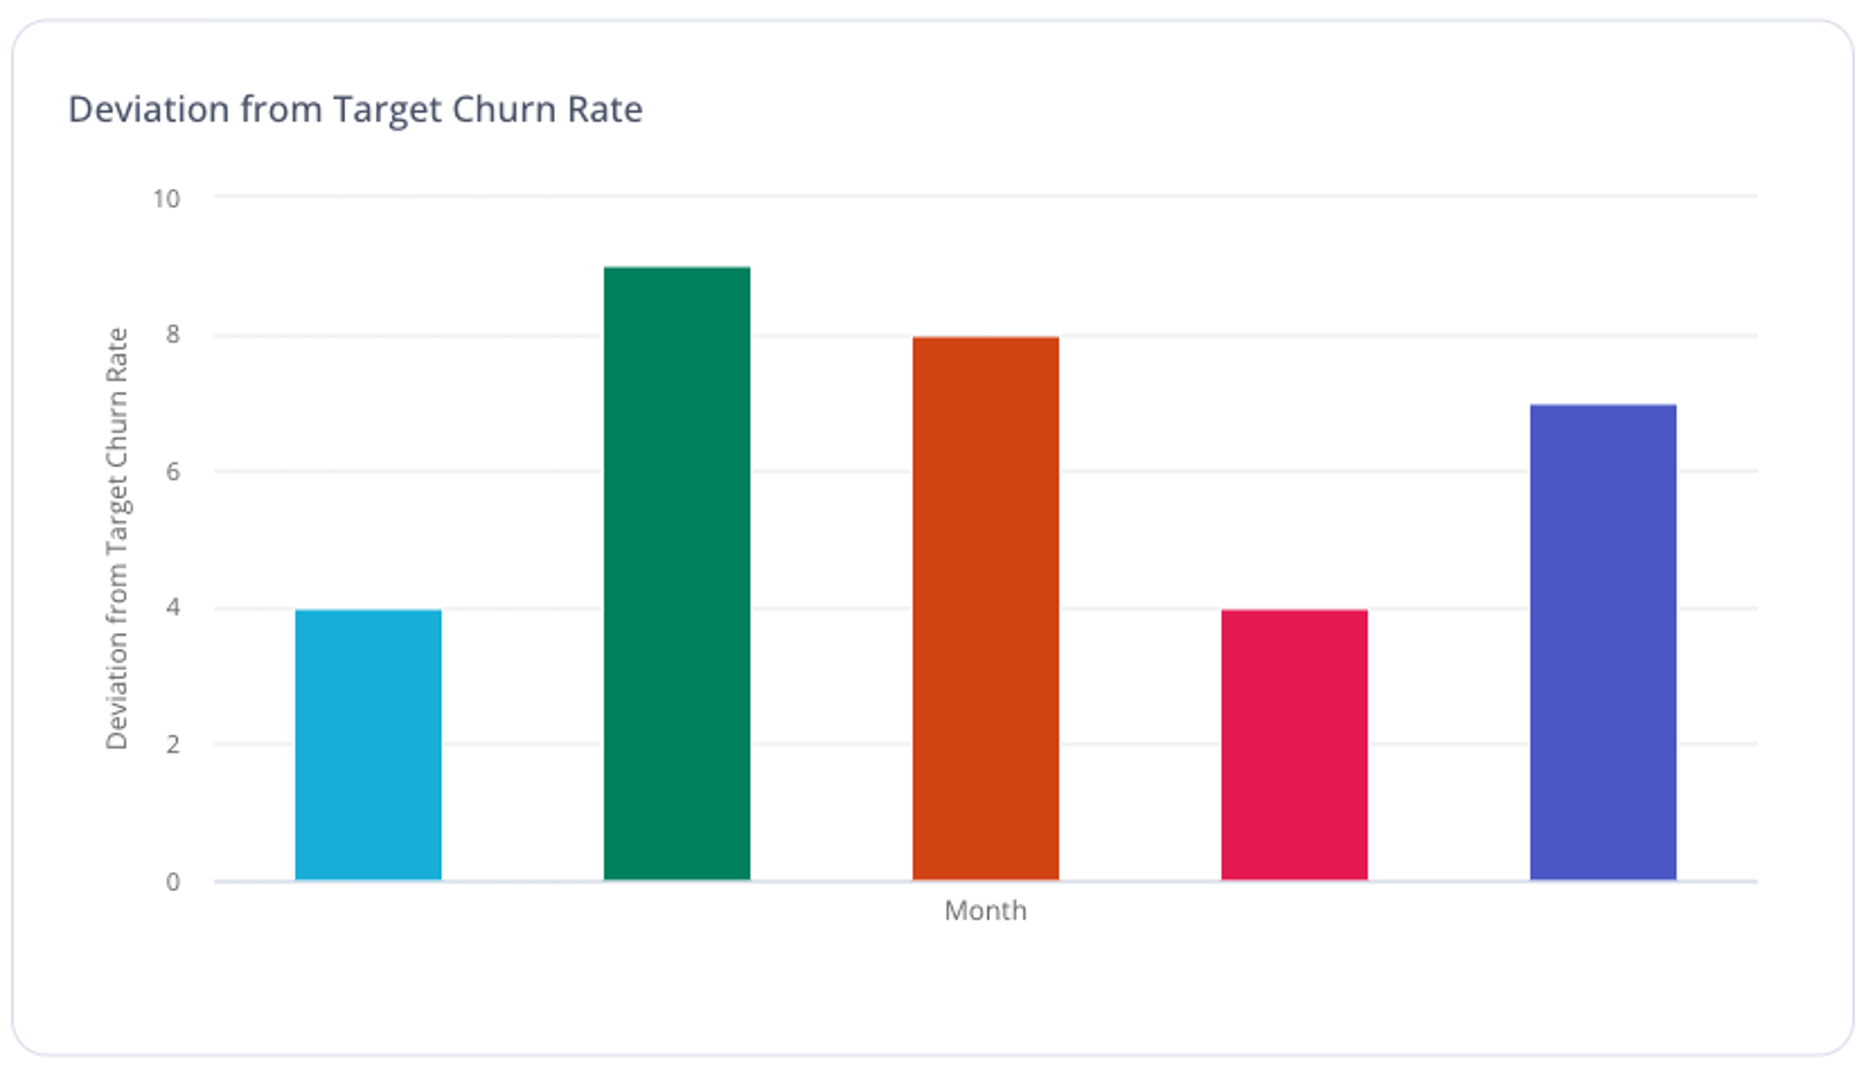
This metric measures how far you are from the churn rate you're aiming to achieve in a given period. Calculate it as forecast churn minus target churn. Tracking the gap, not just the rate itself, gives you an early signal to act before a small miss compounds into a larger problem.
Gross MRR Churn Rate
Expert contributor: Pablo Srugo
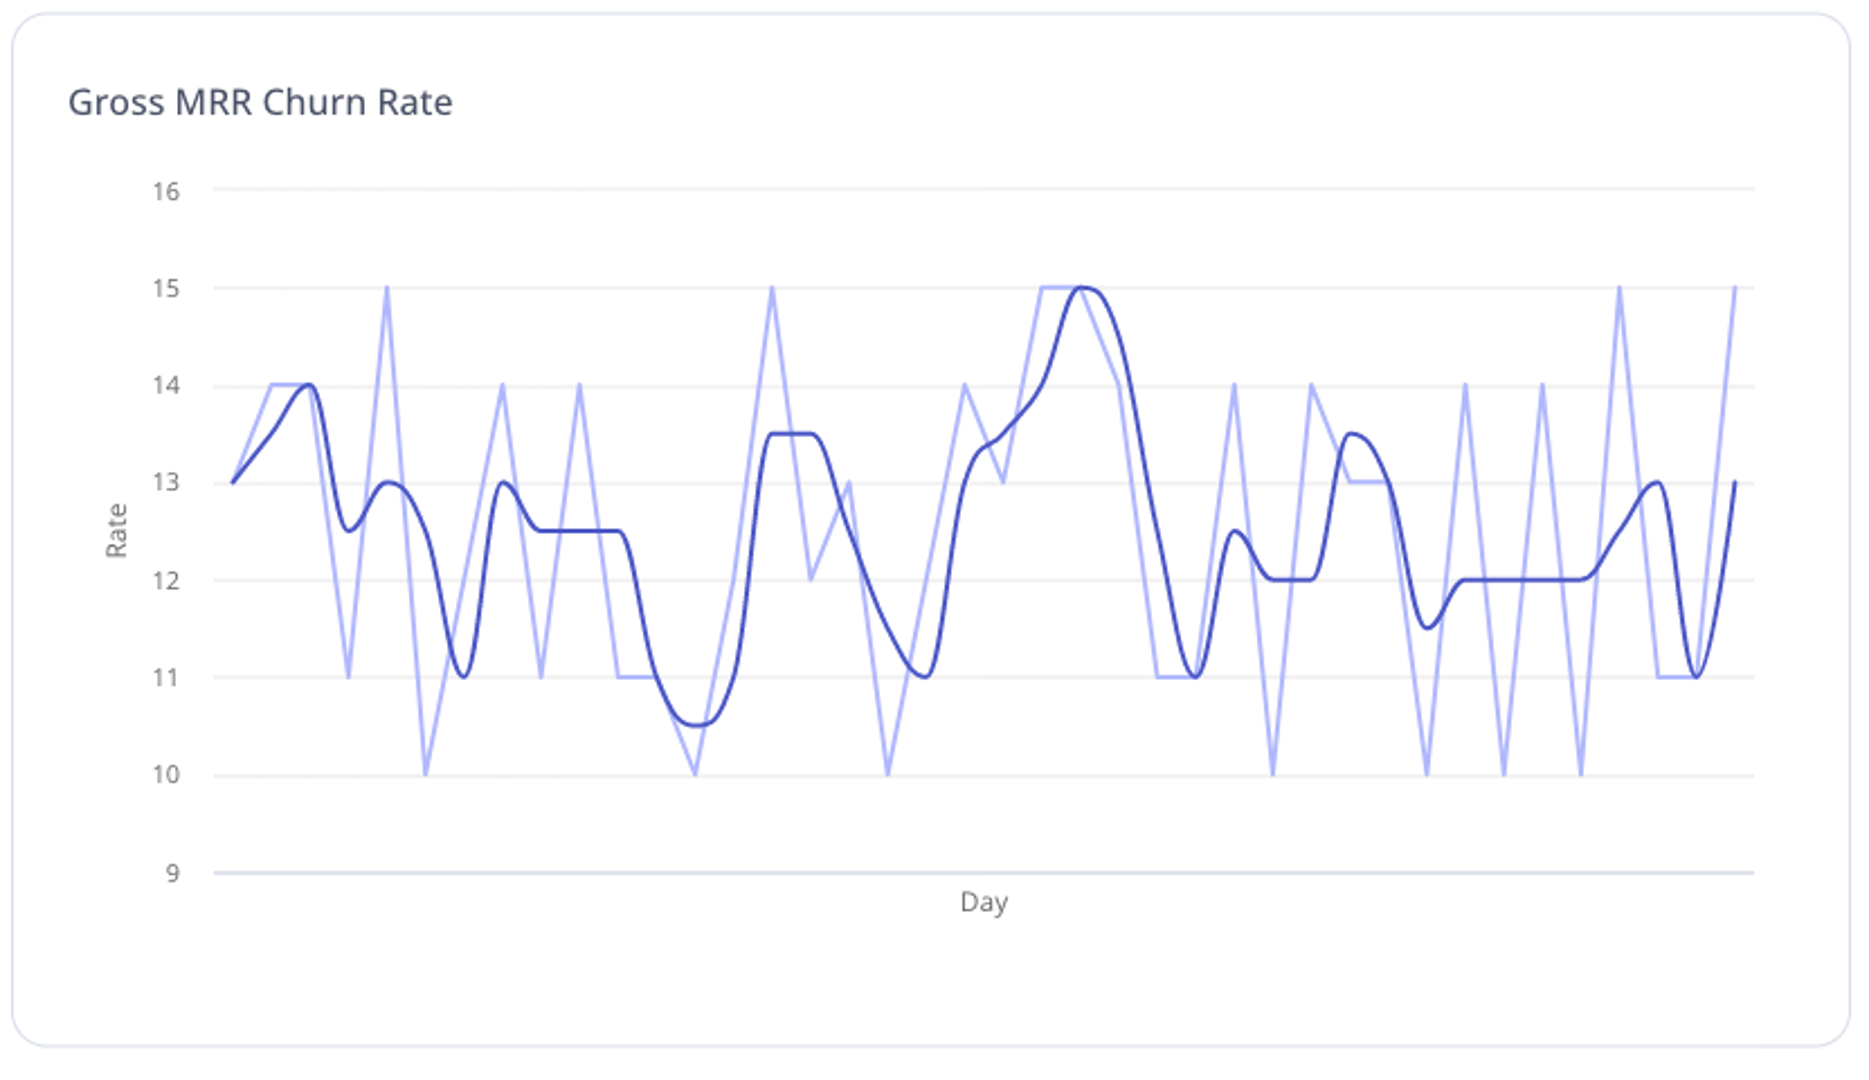
Gross Monthly Recurring Revenue Churn Rate is the percentage of recurring revenue lost to cancellations and downgrades. Often tracked monthly, an annual view works too. It strips out expansion revenue so you see exactly how much of your base you're losing, not how well new business is masking it.
Gross Revenue Retention Rate (GRR)
Expert contributor: Lauren Thibodeau
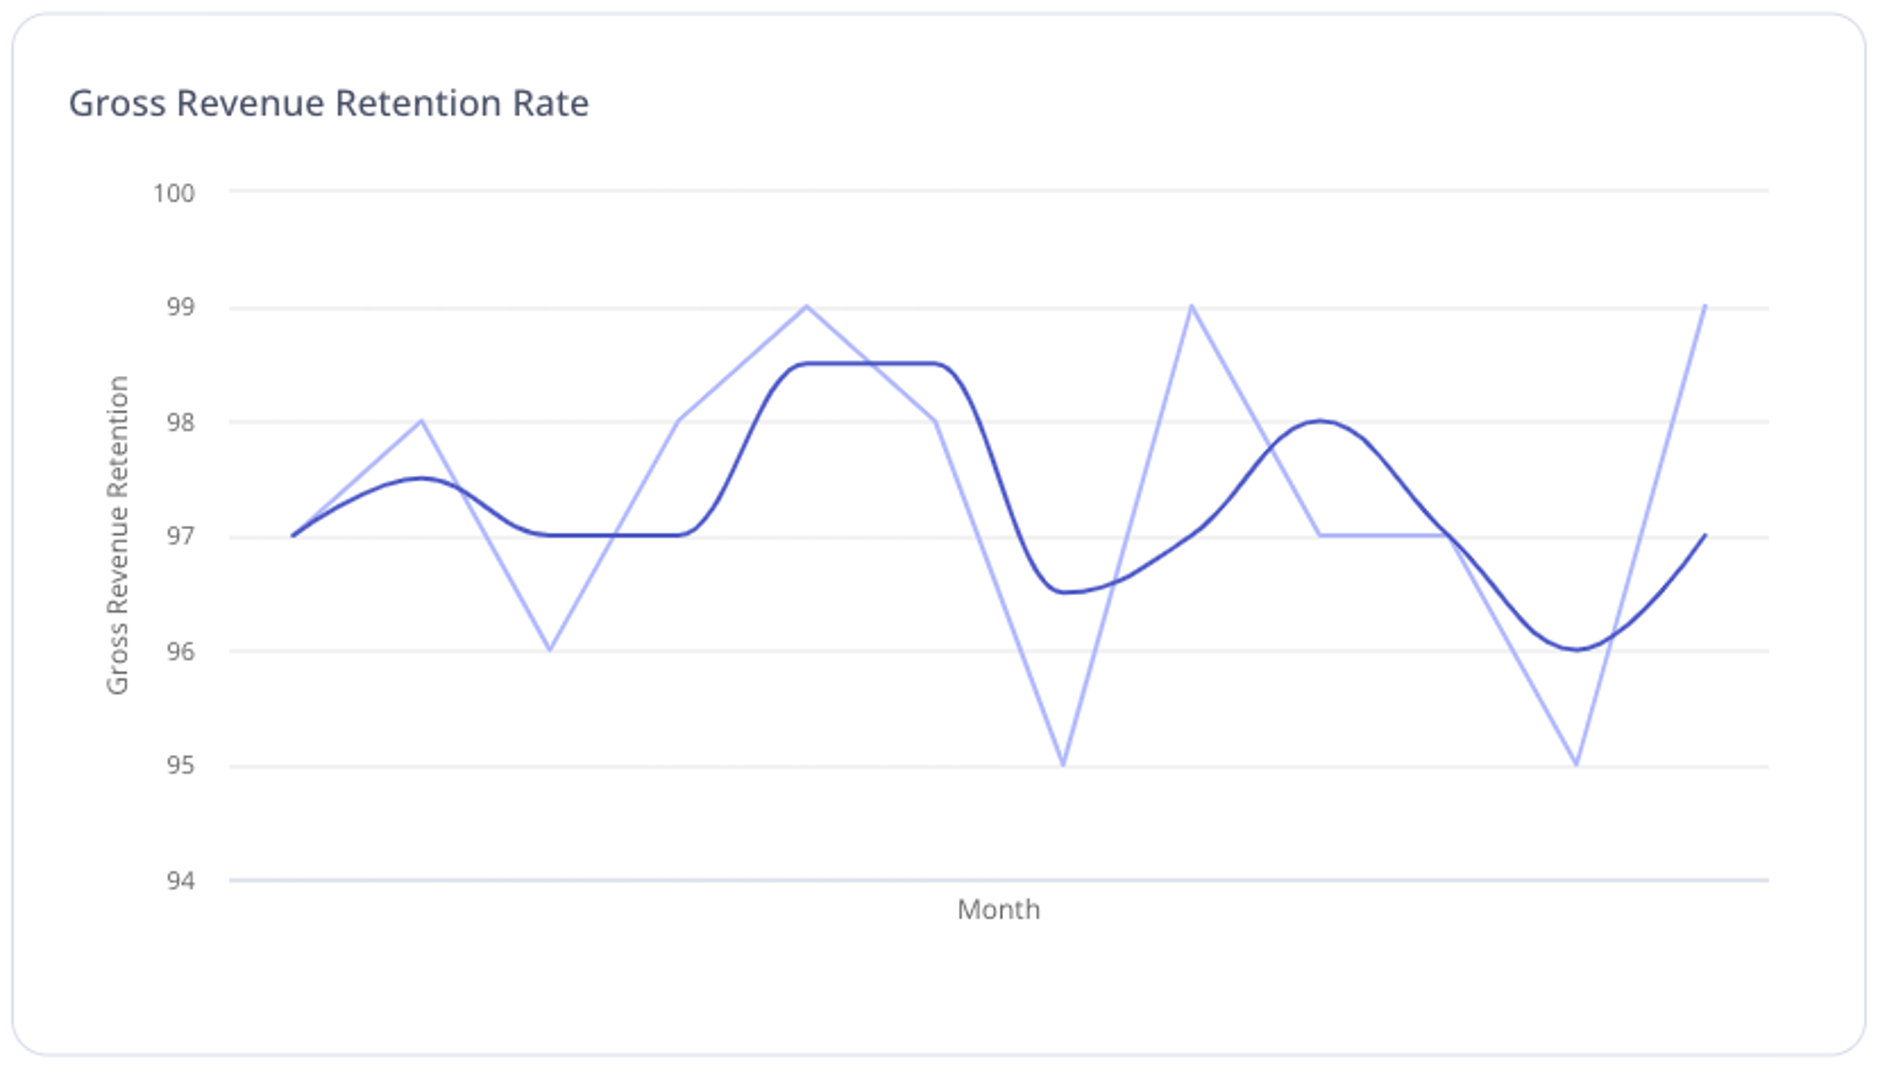
Gross Revenue Retention (GRR) is the percentage of recurring revenue retained from existing customers in a period, including downgrades and cancellations, and excluding expansion. GRR tells you how sticky the business is at its core. Strong GRR means the foundation is solid, regardless of what new logos are doing.
Hype Factor
Expert contributor: Dave Kellogg
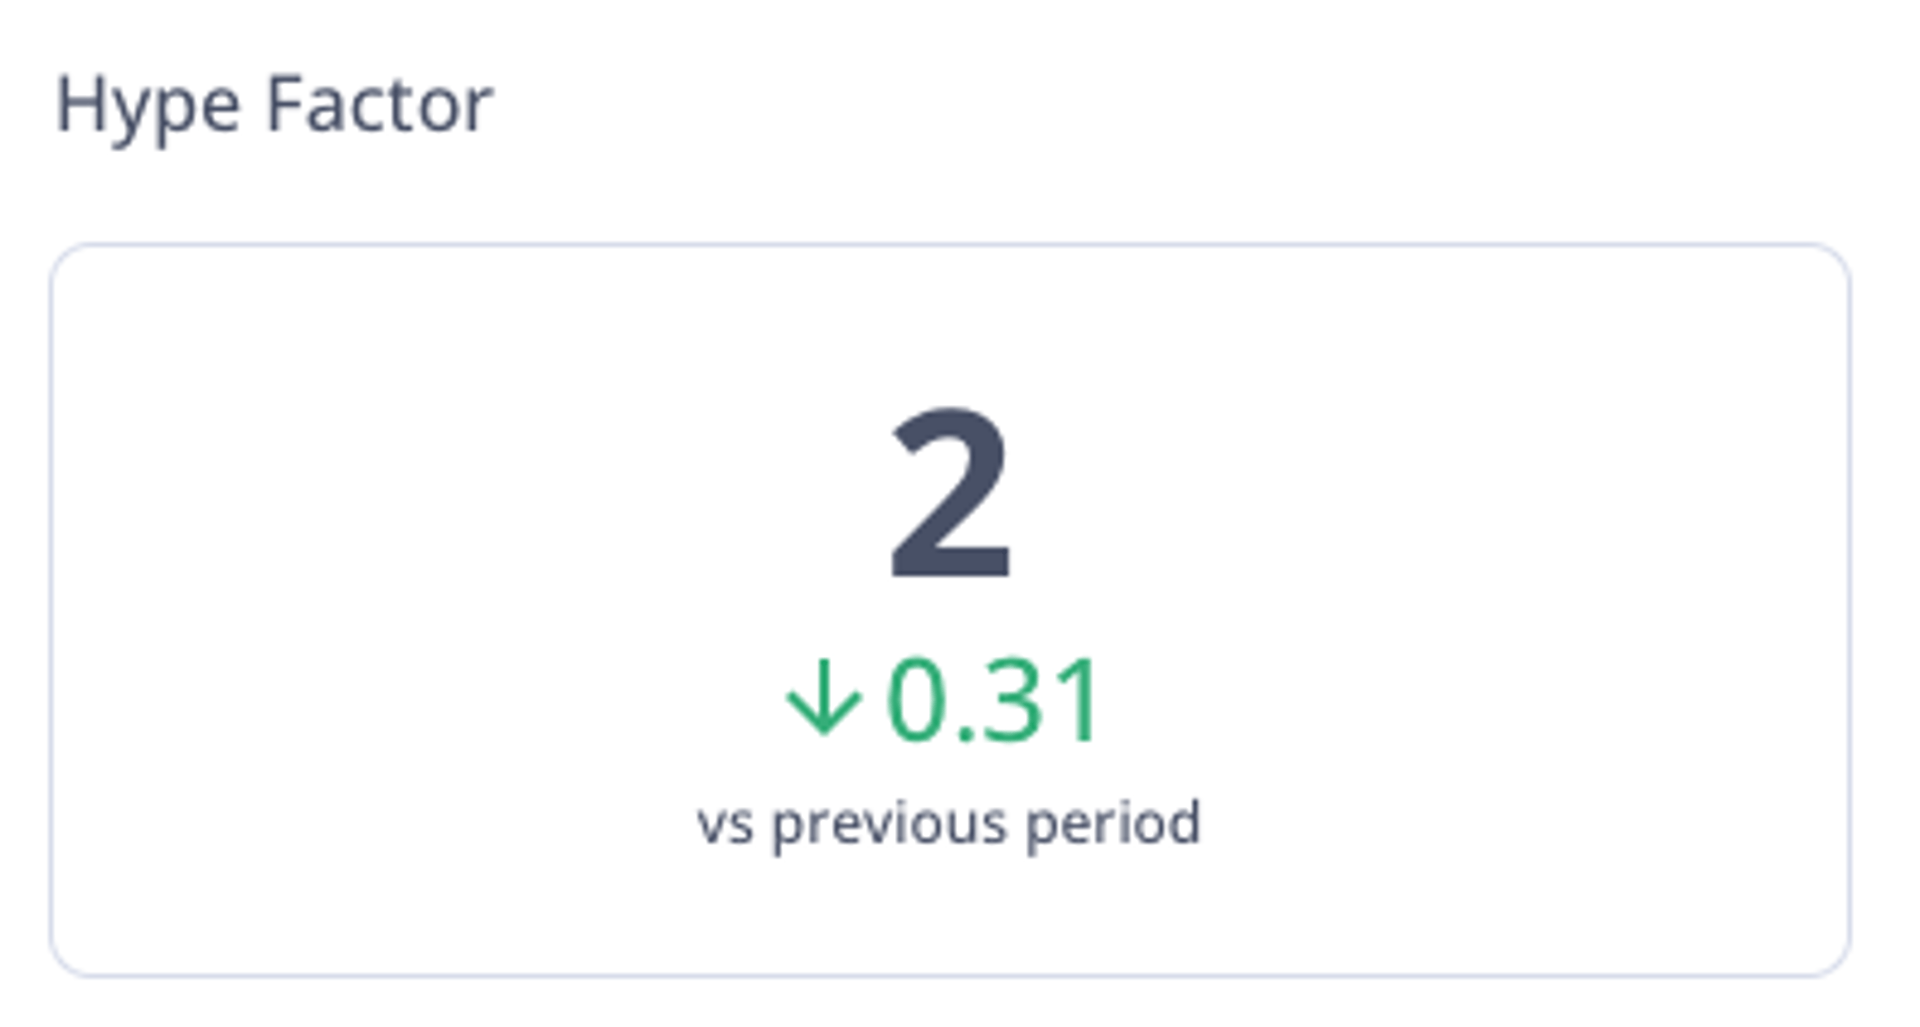
Hype Factor is an efficiency metric showing how well a company converts capital raised into ARR. ARR has direct value as it turns into GAAP revenue annually. Hype helps only if it creates halo effects that increase interest and ARR. If the ratio is moving in the wrong direction, it's a signal worth surfacing before the next funding conversation.
Lifetime Value to Cost of Acquisition Ratio (LTV/CAC)
Expert contributor: Eckhard Ortwein
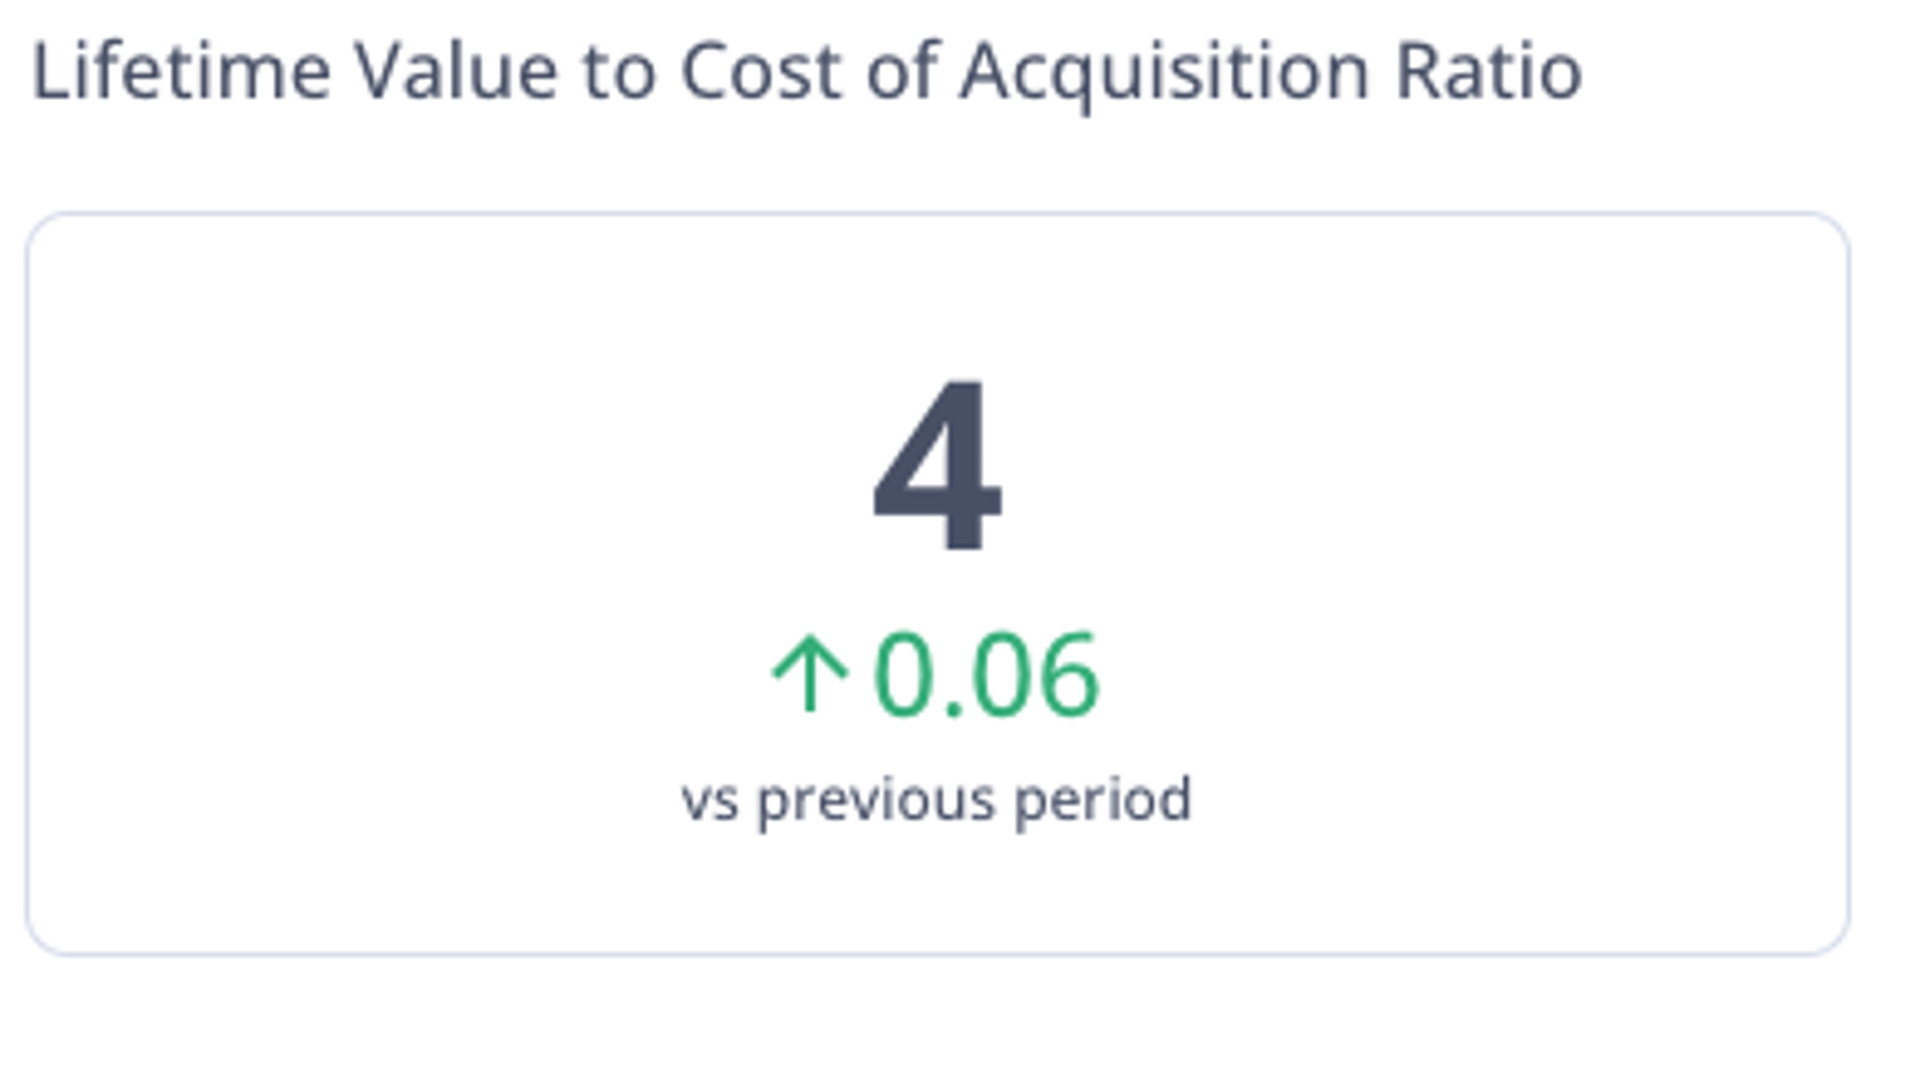
LTV/CAC compares the lifetime revenue expected from a customer to the cost to acquire that customer. Ratios above 3:1 are often cited as healthy for SaaS, but context matters. This ratio is one of the clearest signals of whether the business model is working, and investors will look at it closely.
Logo Churn
Expert contributor: Soha Yasrebi
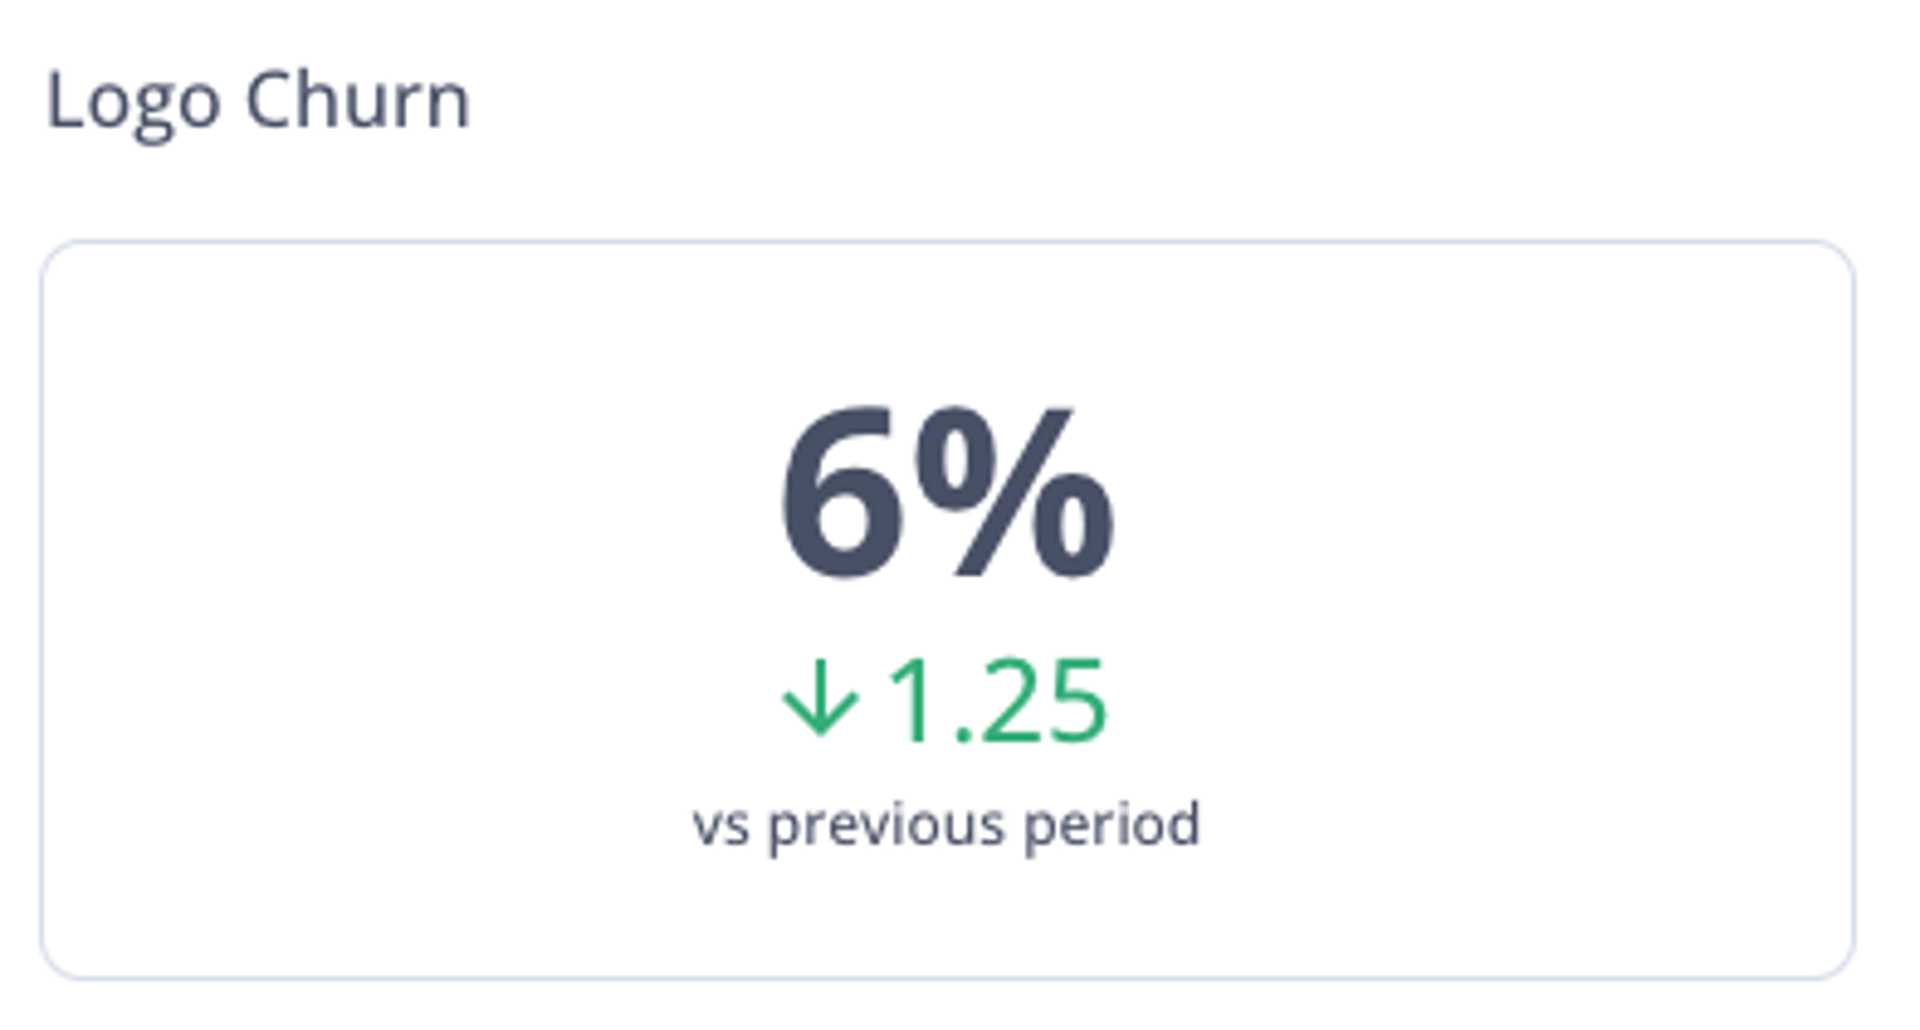
Logo Churn is the number or percentage of customers who end their subscription in a period. Lower logo churn unlocks stronger net revenue retention. Even when revenue retention looks healthy, high logo churn can signal product or fit problems that will catch up with you.
MRR Growth Rate
Expert contributors: Taylor Wilson, Snita Balsara
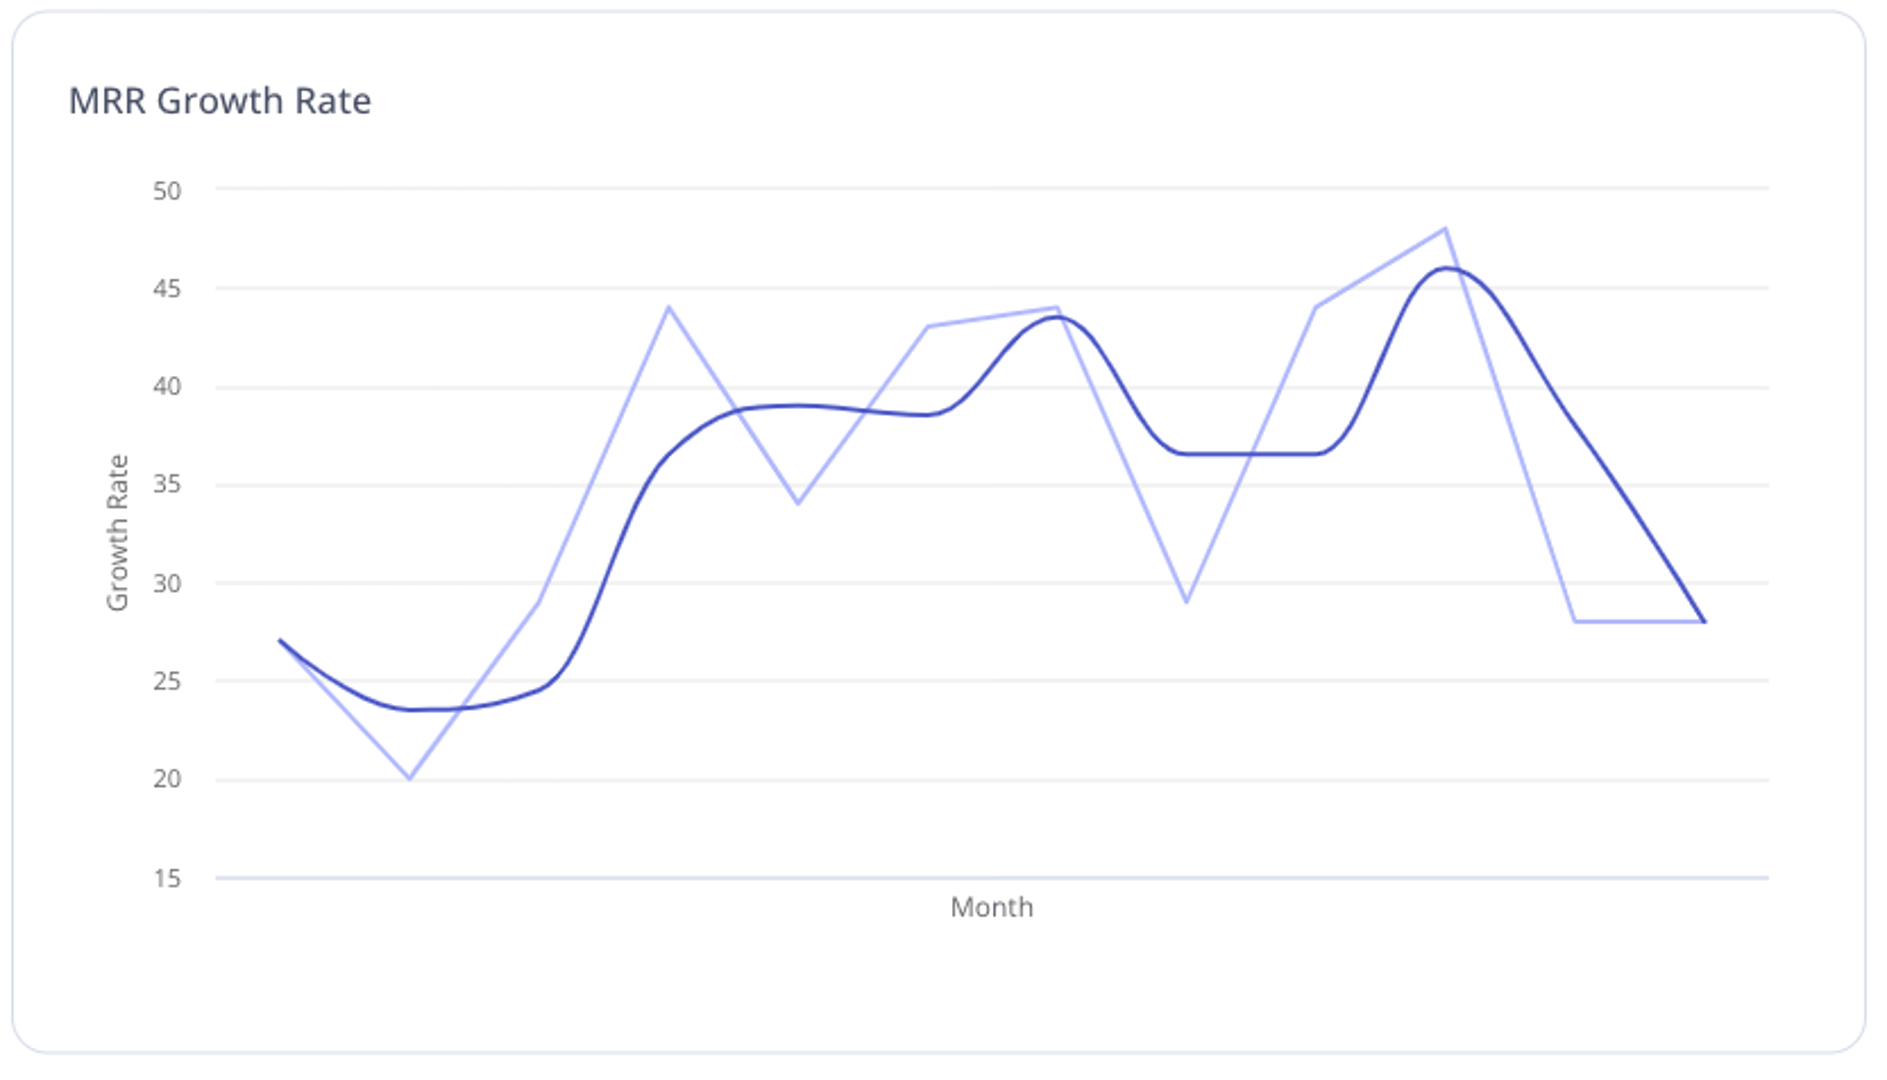
Monthly Recurring Revenue (MRR) Growth Rate expresses how quickly MRR is increasing. Track monthly or annually, and pair it with churn and expansion metrics. Growth rate alone doesn't tell the full story; the mix of new, expansion, and churned revenue is where the real insight lives.
Net Annual Recurring Revenue Added (Net ARR Added)
Expert contributor: Paula Diaz
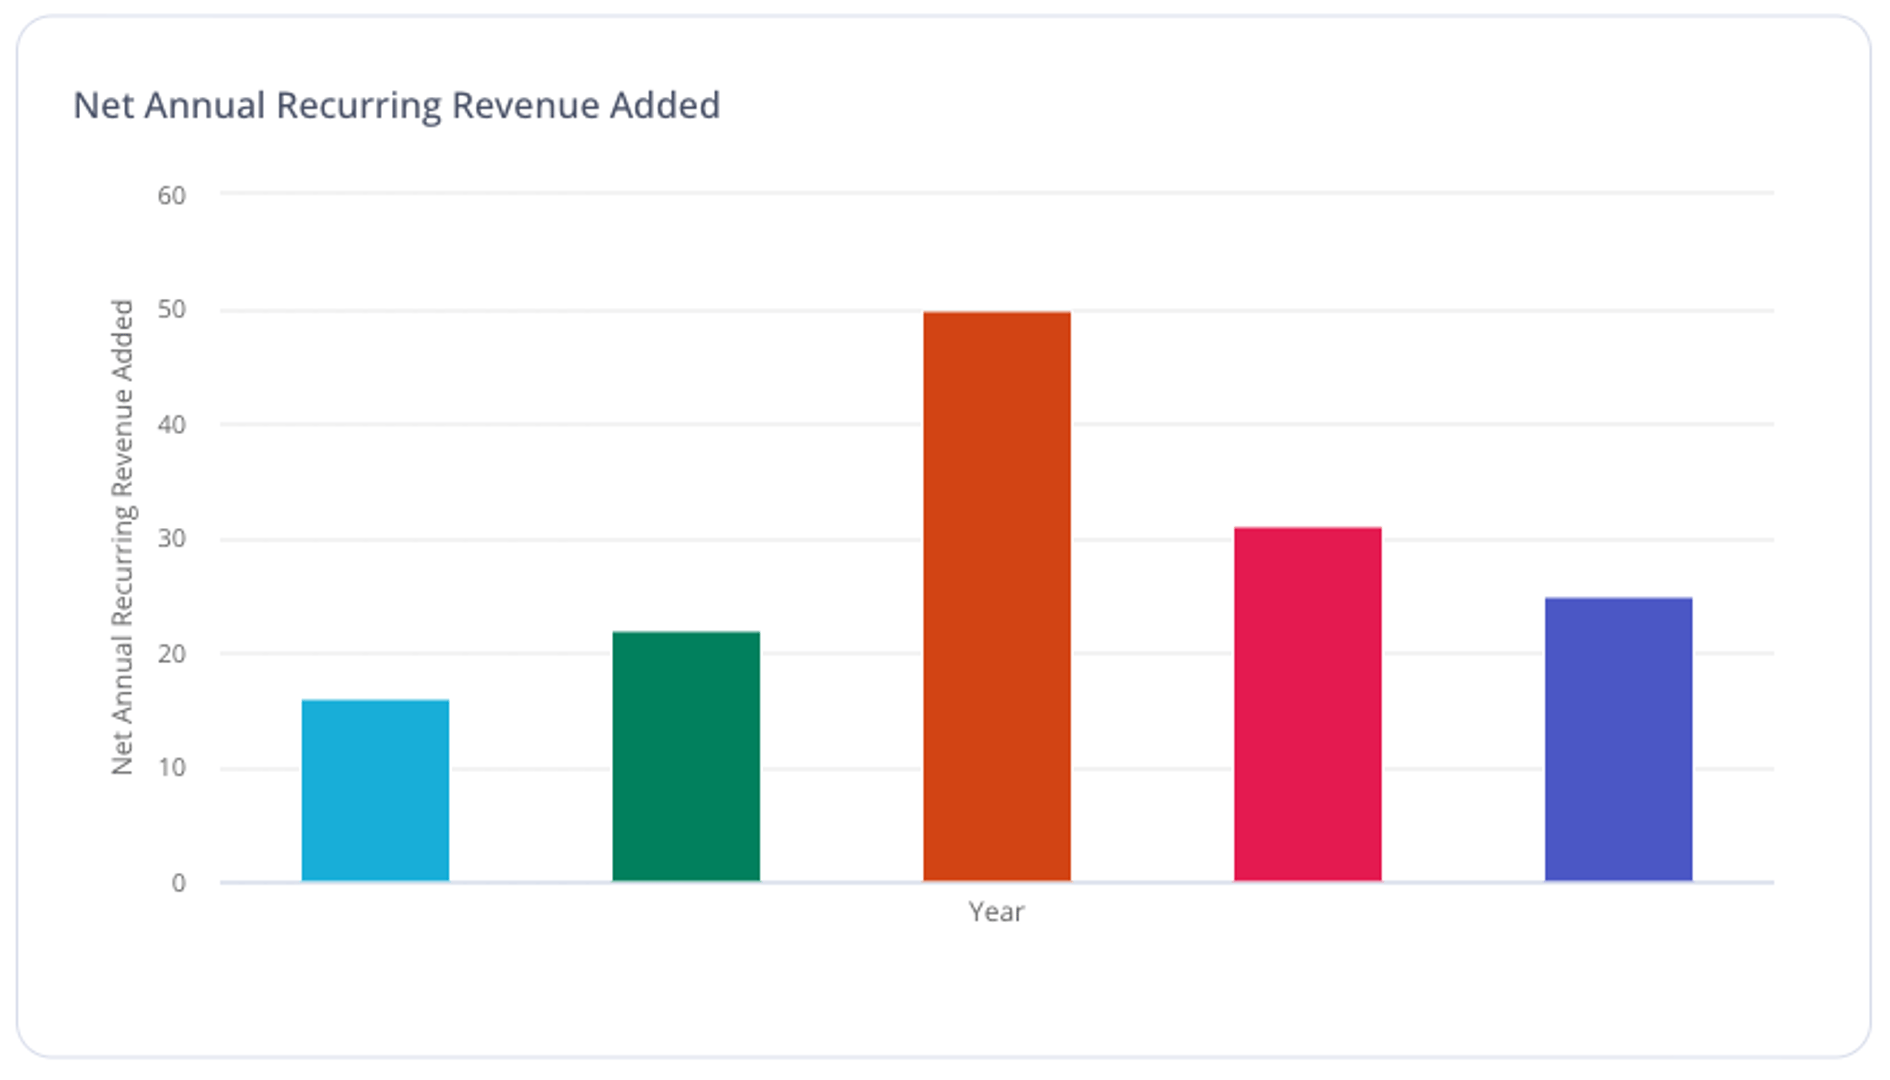
Net ARR Added is the net change in annual recurring revenue from new logos, expansion, down-sell, and churn in a period. Use it to understand the components of growth. Breaking it down by source shows you where momentum is coming from and where it's leaking.
Payment Acceptance
Expert contributor: Ed Fry
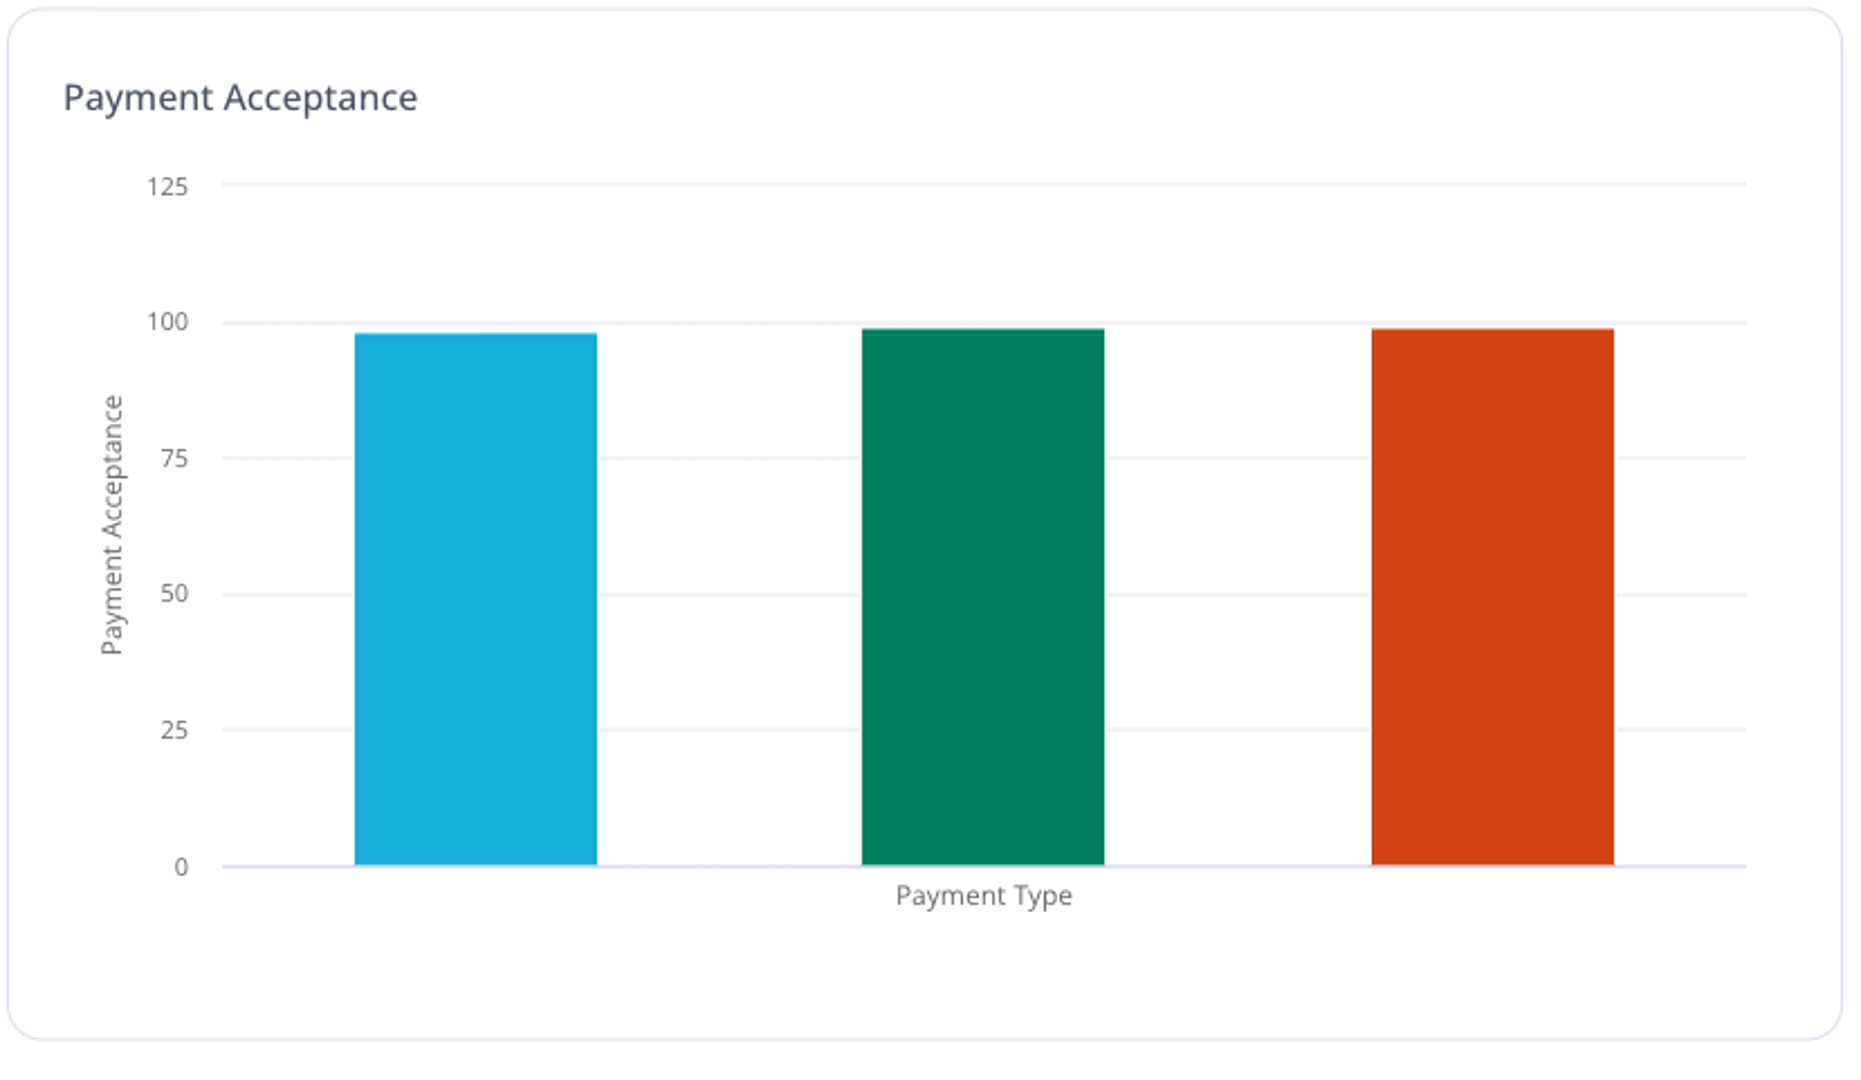
Payment Acceptance is the percentage of successful payments out of attempted payments. In card processing, this is often called the "authorization rate." Failed payments are silent revenue leaks. Improving this rate doesn't require new customers; it recovers revenue you've already earned.
Propensity to Renew
Expert contributor: Jennifer Batley
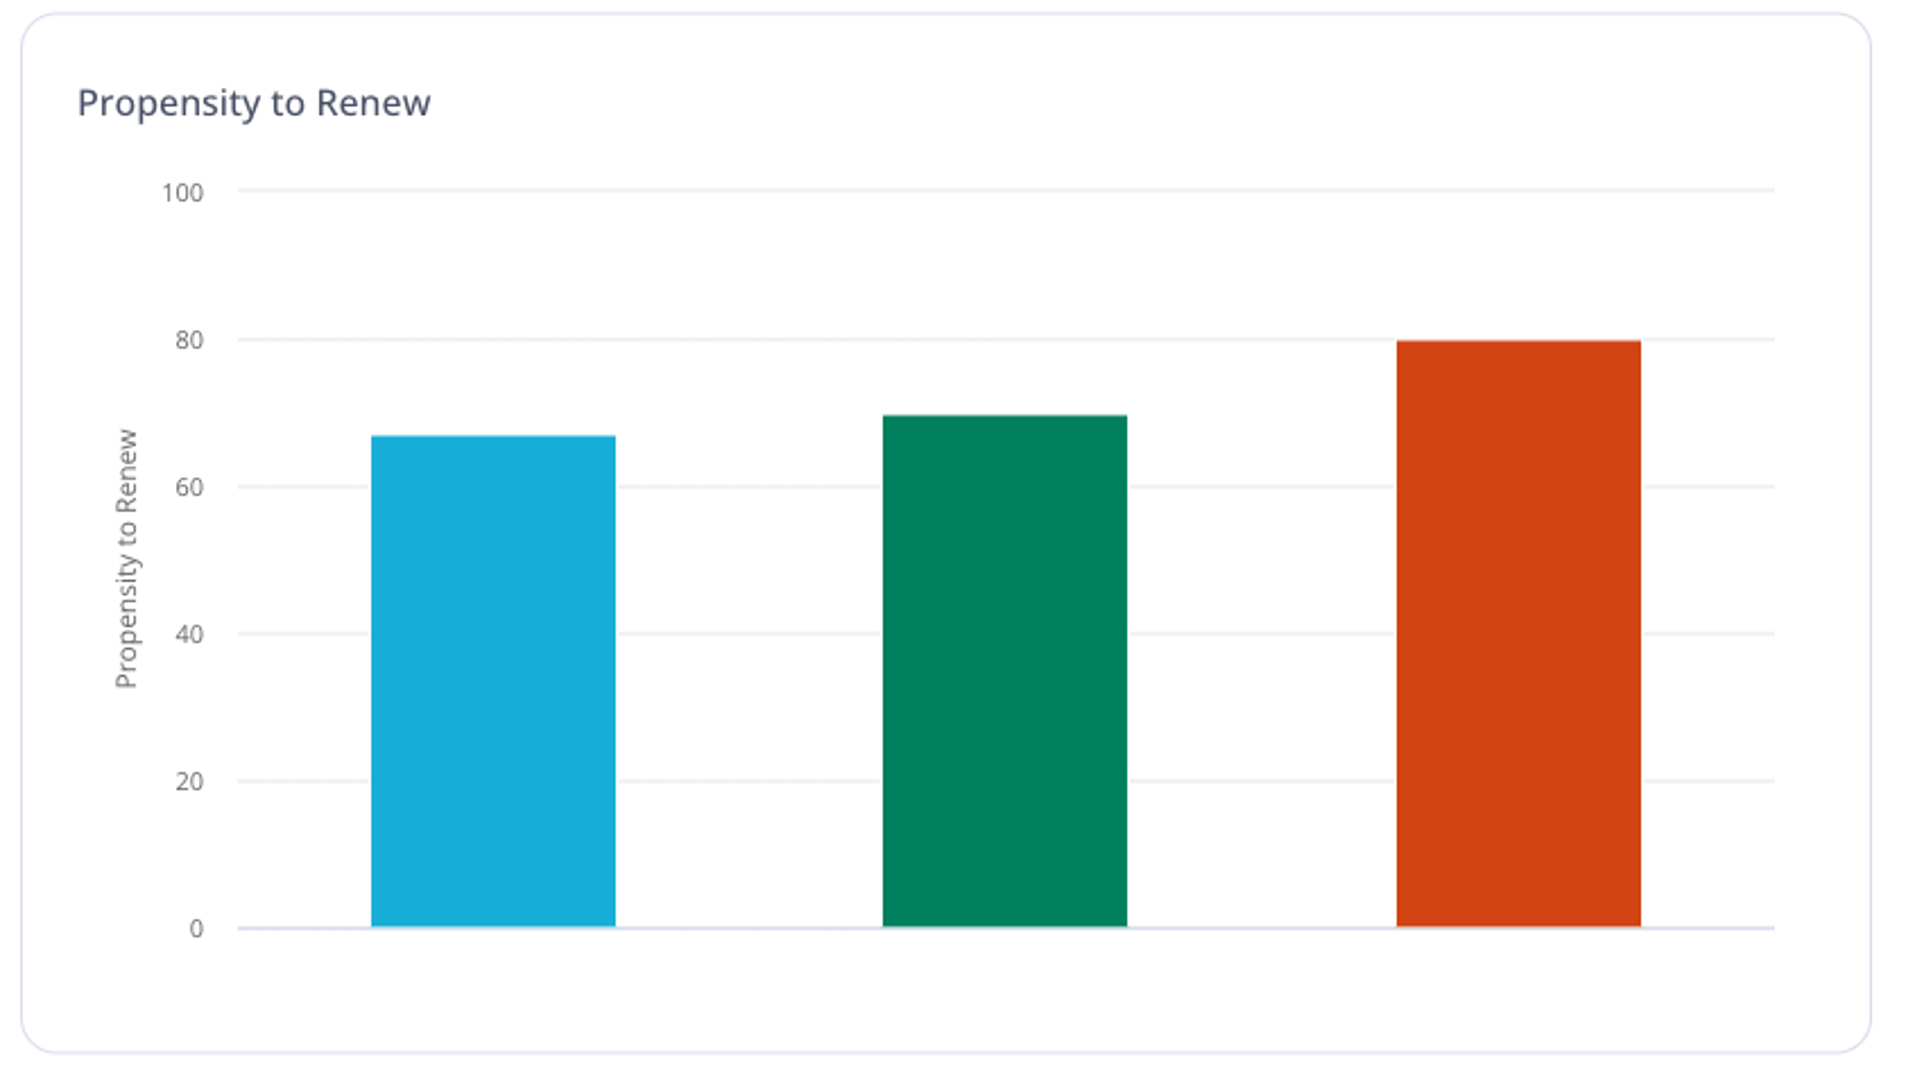
Propensity to Renew estimates the likelihood a customer will renew their contract, often sourced from customer surveys. It's an early indicator of revenue risk and potential logo churn. Watching this metric gives you time to act before a renewal becomes a cancellation.
Reactivation MRR
Expert contributor: Susan Luo
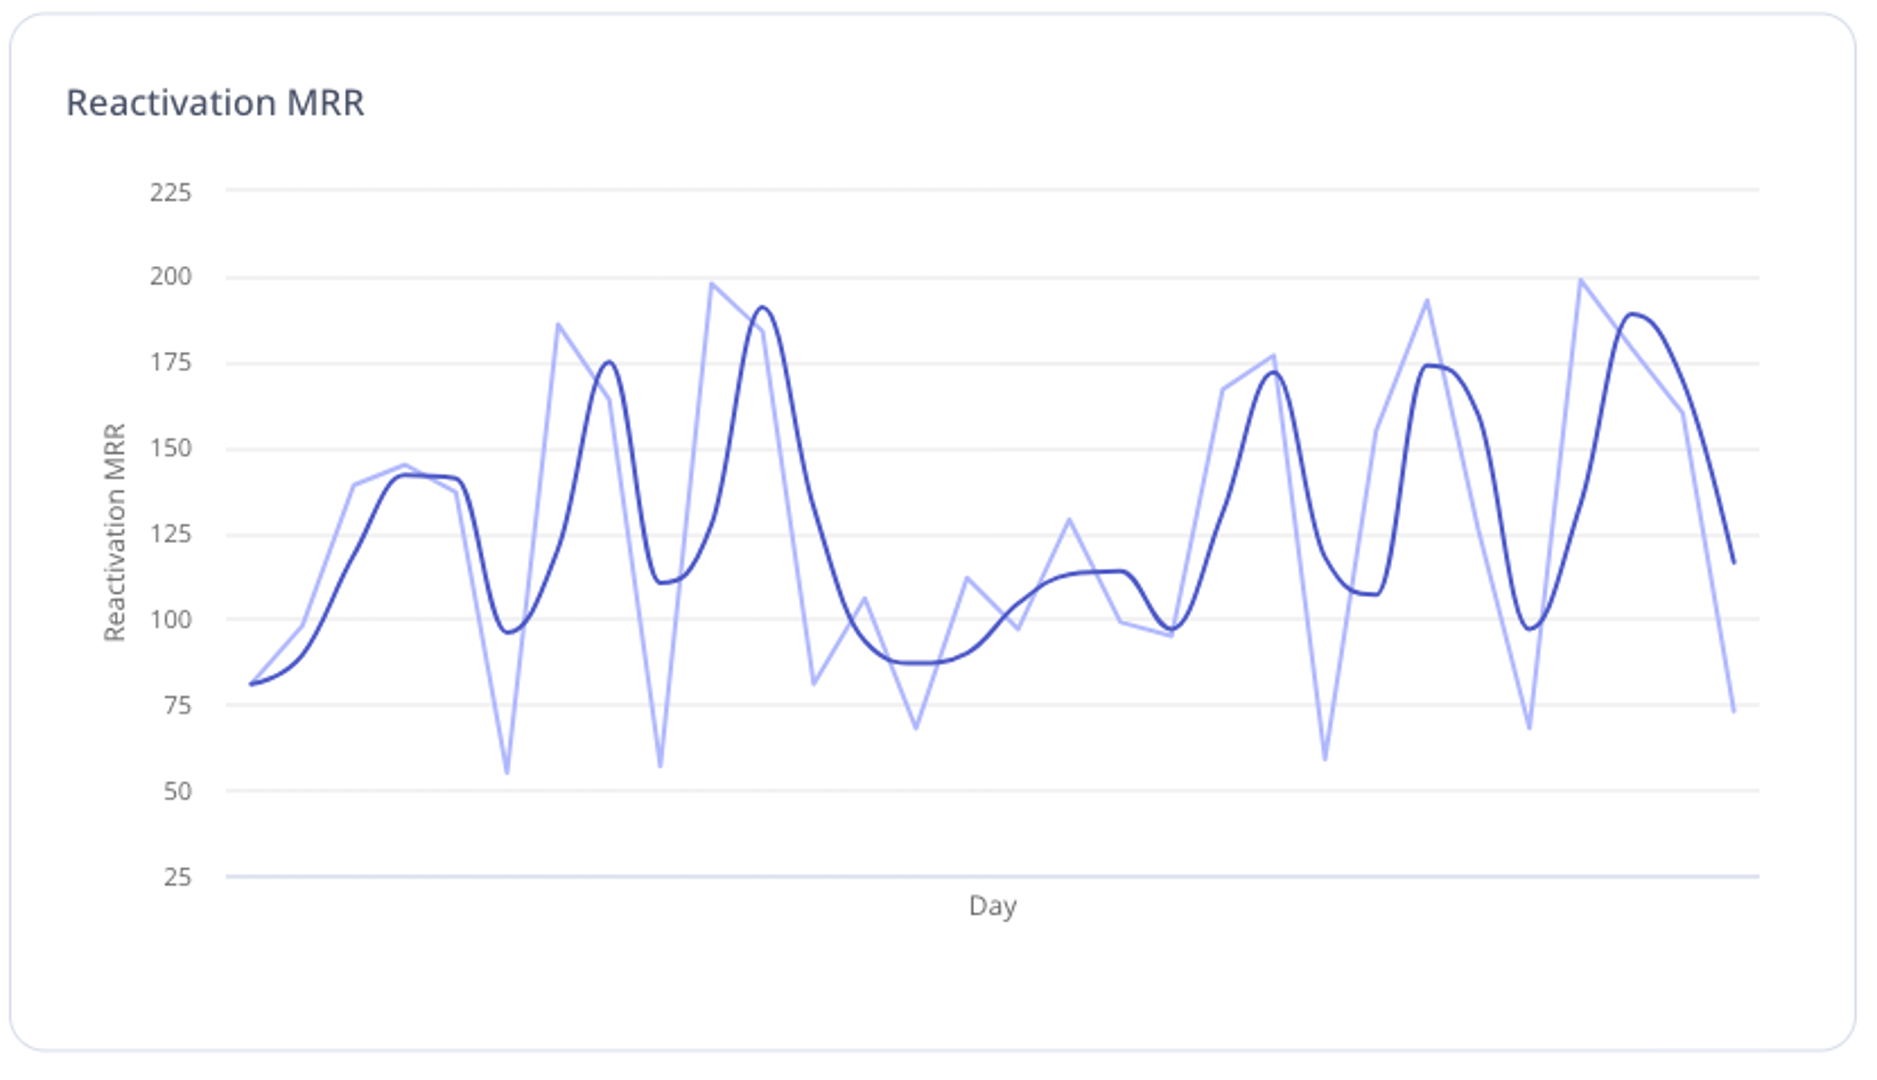
Reactivation MRR is recurring revenue from customers who previously cancelled service and returned within the current tracking period. It's easy to overlook, but reactivated customers are often faster to close and less expensive to win back than acquiring someone new.
SaaS Magic Number
Expert contributors: Will Cordes, Alamin Mollick
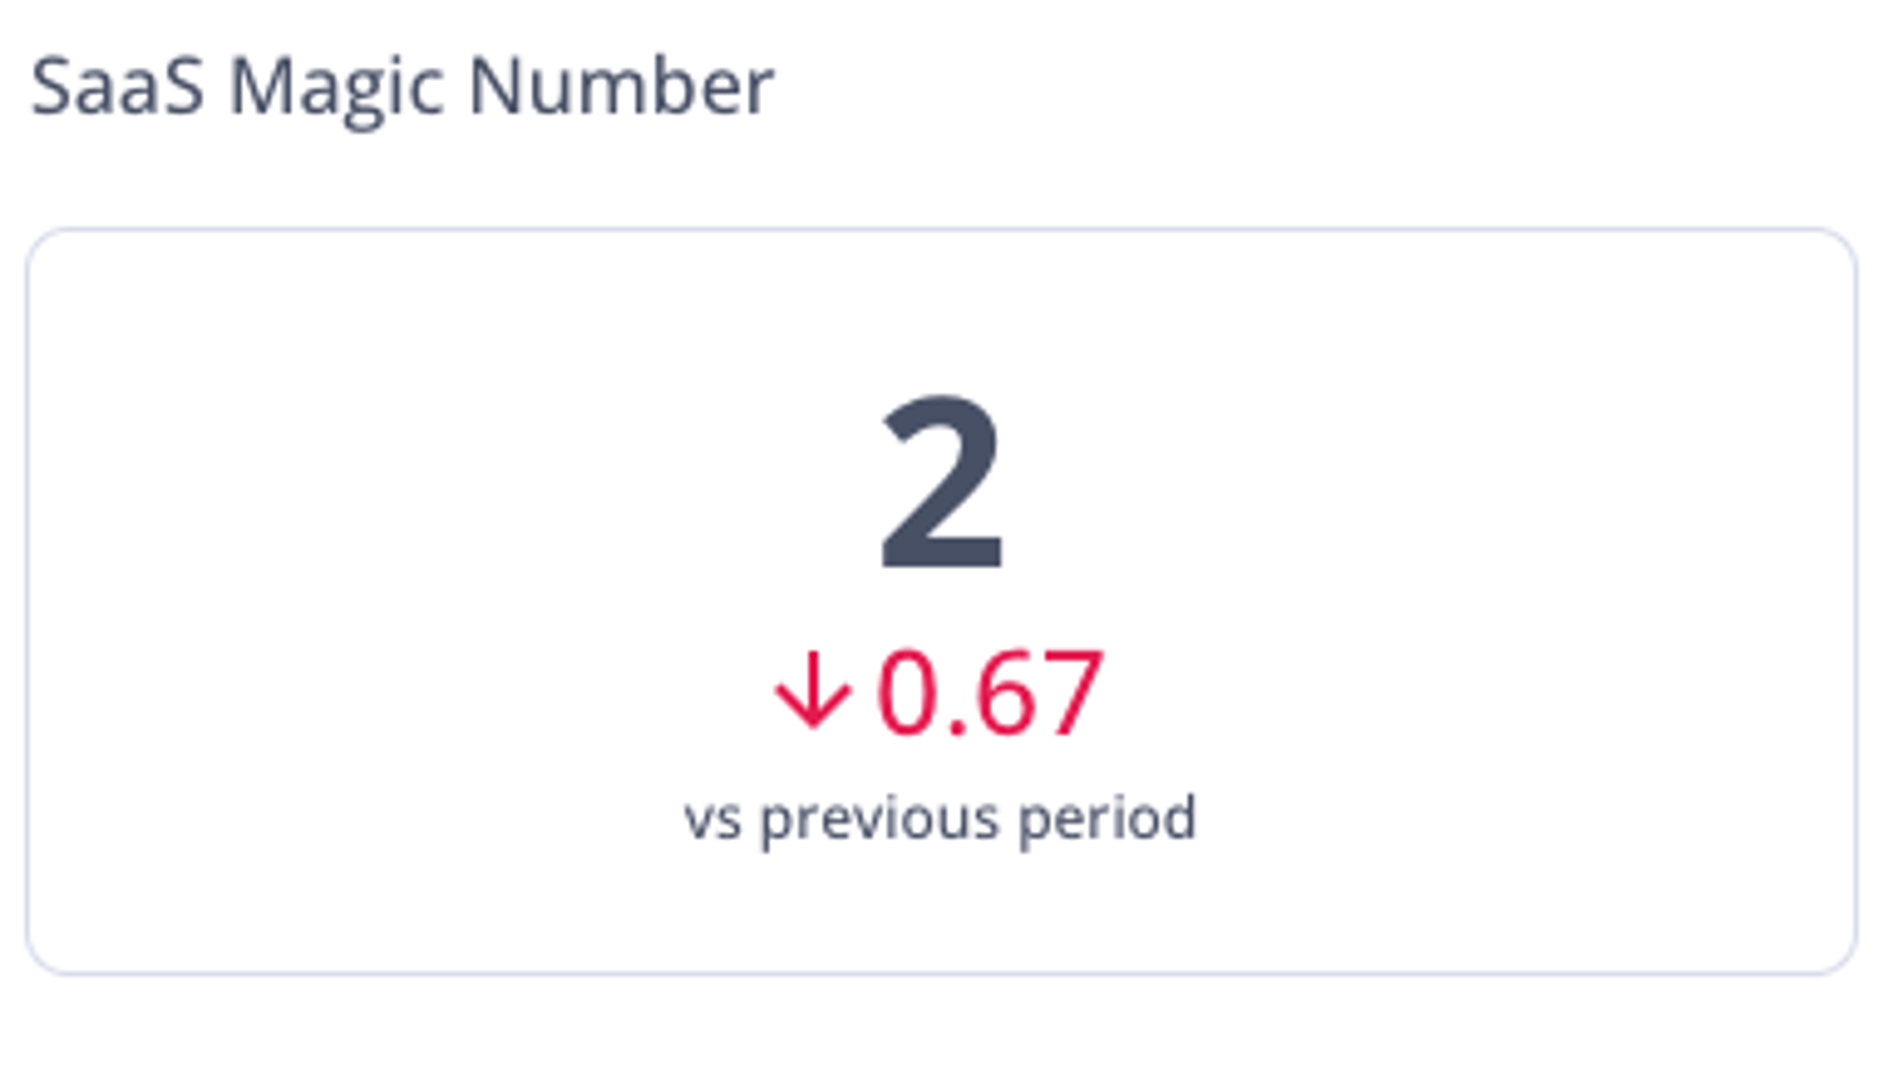
The SaaS Magic Number estimates ARR gained for every sales and marketing dollar. Use it to judge the sustainability of go-to-market spend. A strong Magic Number tells you it's safe to invest more; a weak one tells you to fix efficiency before adding fuel.
SaaS Quick Ratio
Expert contributor: Susan Richards
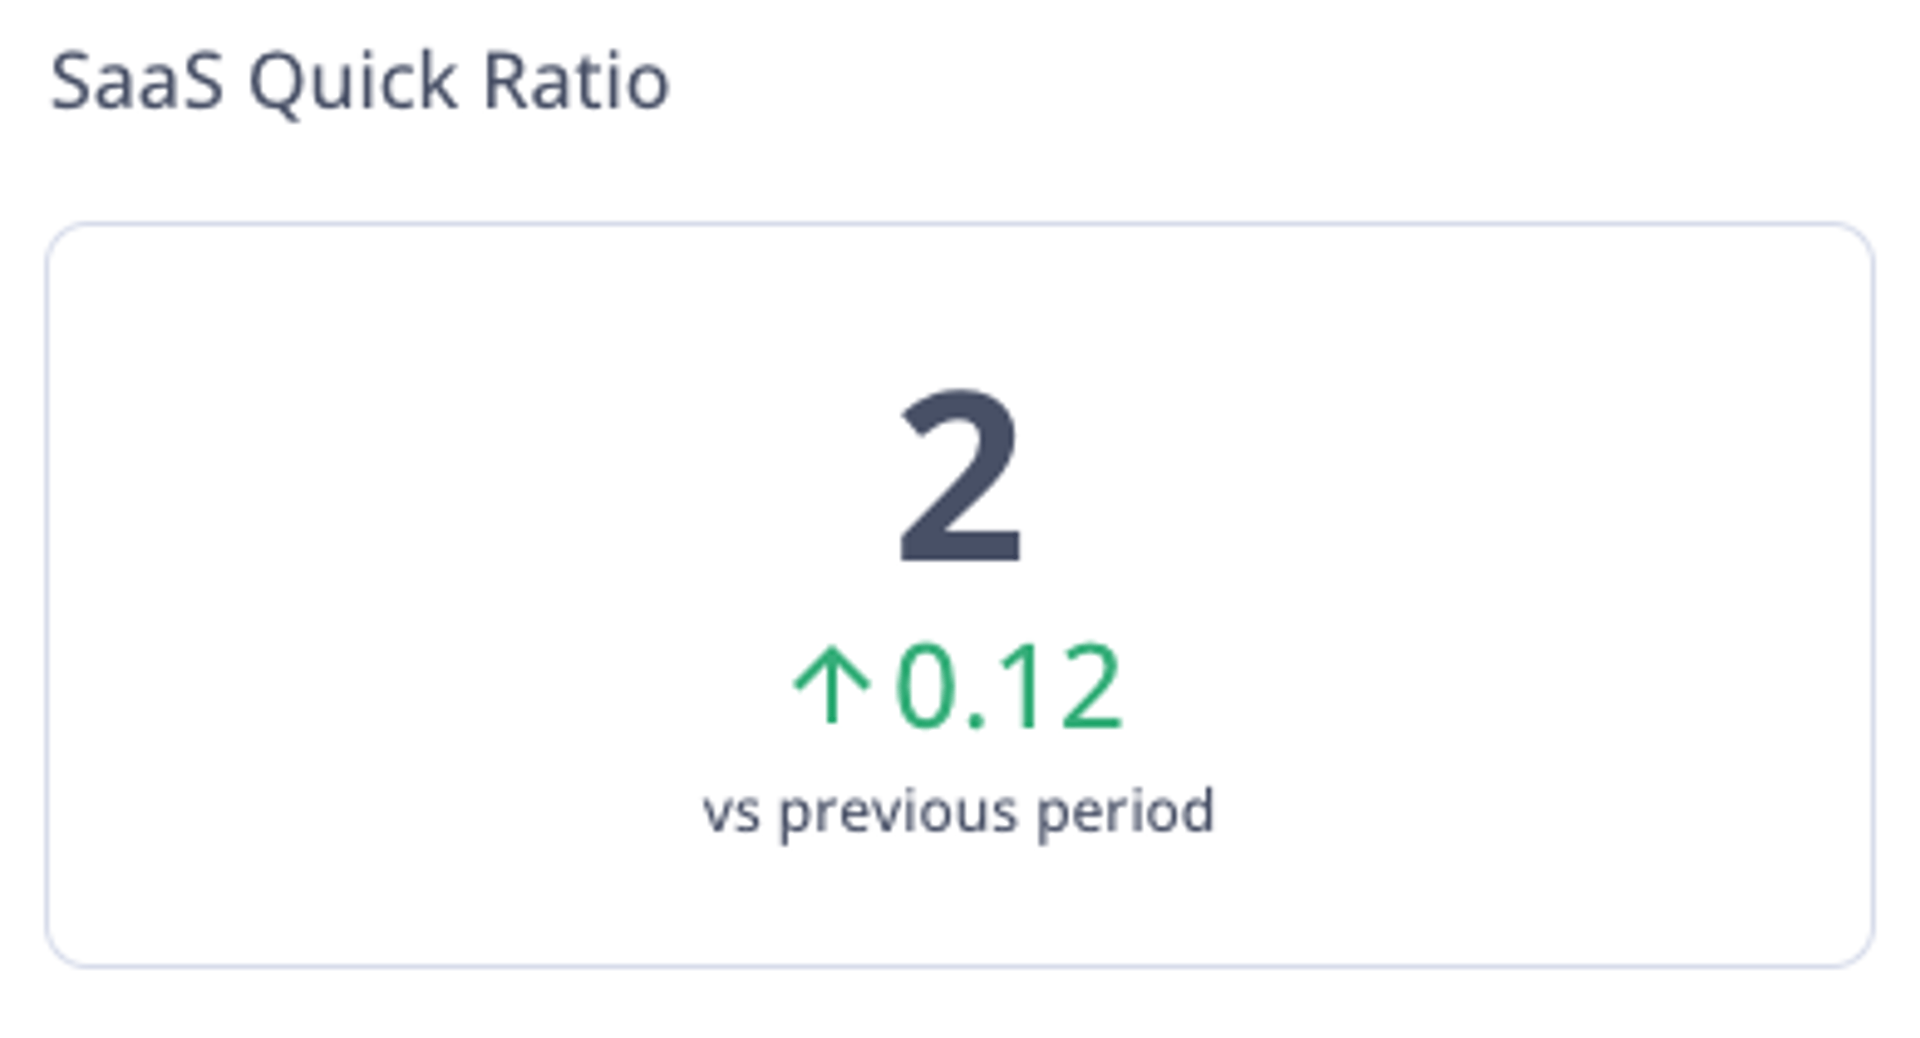
SaaS Quick Ratio assesses growth efficiency by comparing new and expansion MRR against churn and contraction. Higher ratios signal healthier growth. It's a fast read on whether the business is growing cleanly or papering over churn with new bookings.
The Rule of 40
Expert contributors: Ben Murray, Adrian Bunter
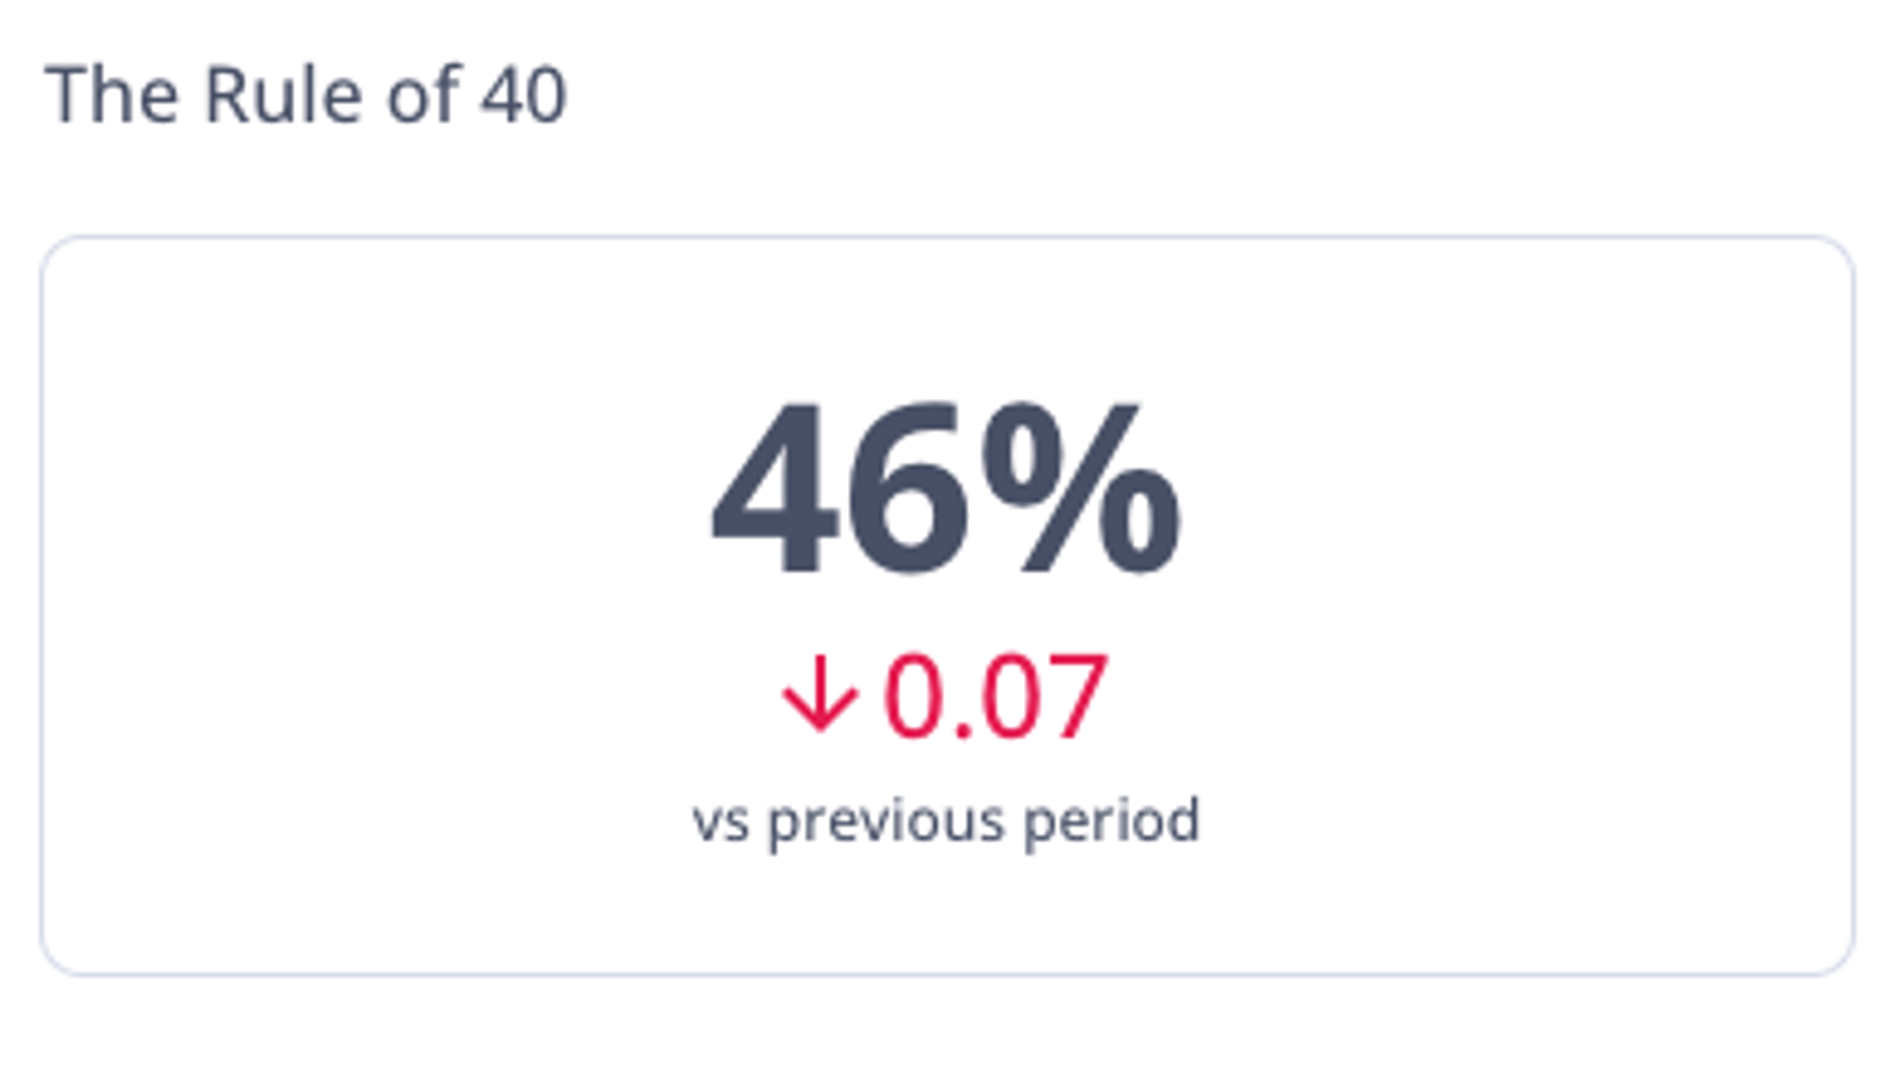
The Rule of 40 balances revenue growth rate and profit margin to give a quick read on overall company health. A combined score above 40 is generally considered strong. It's one of the benchmarks investors use to assess whether a SaaS company is scaling responsibly.
Total Addressable Market (TAM)
Expert contributor: Lauren Thibodeau
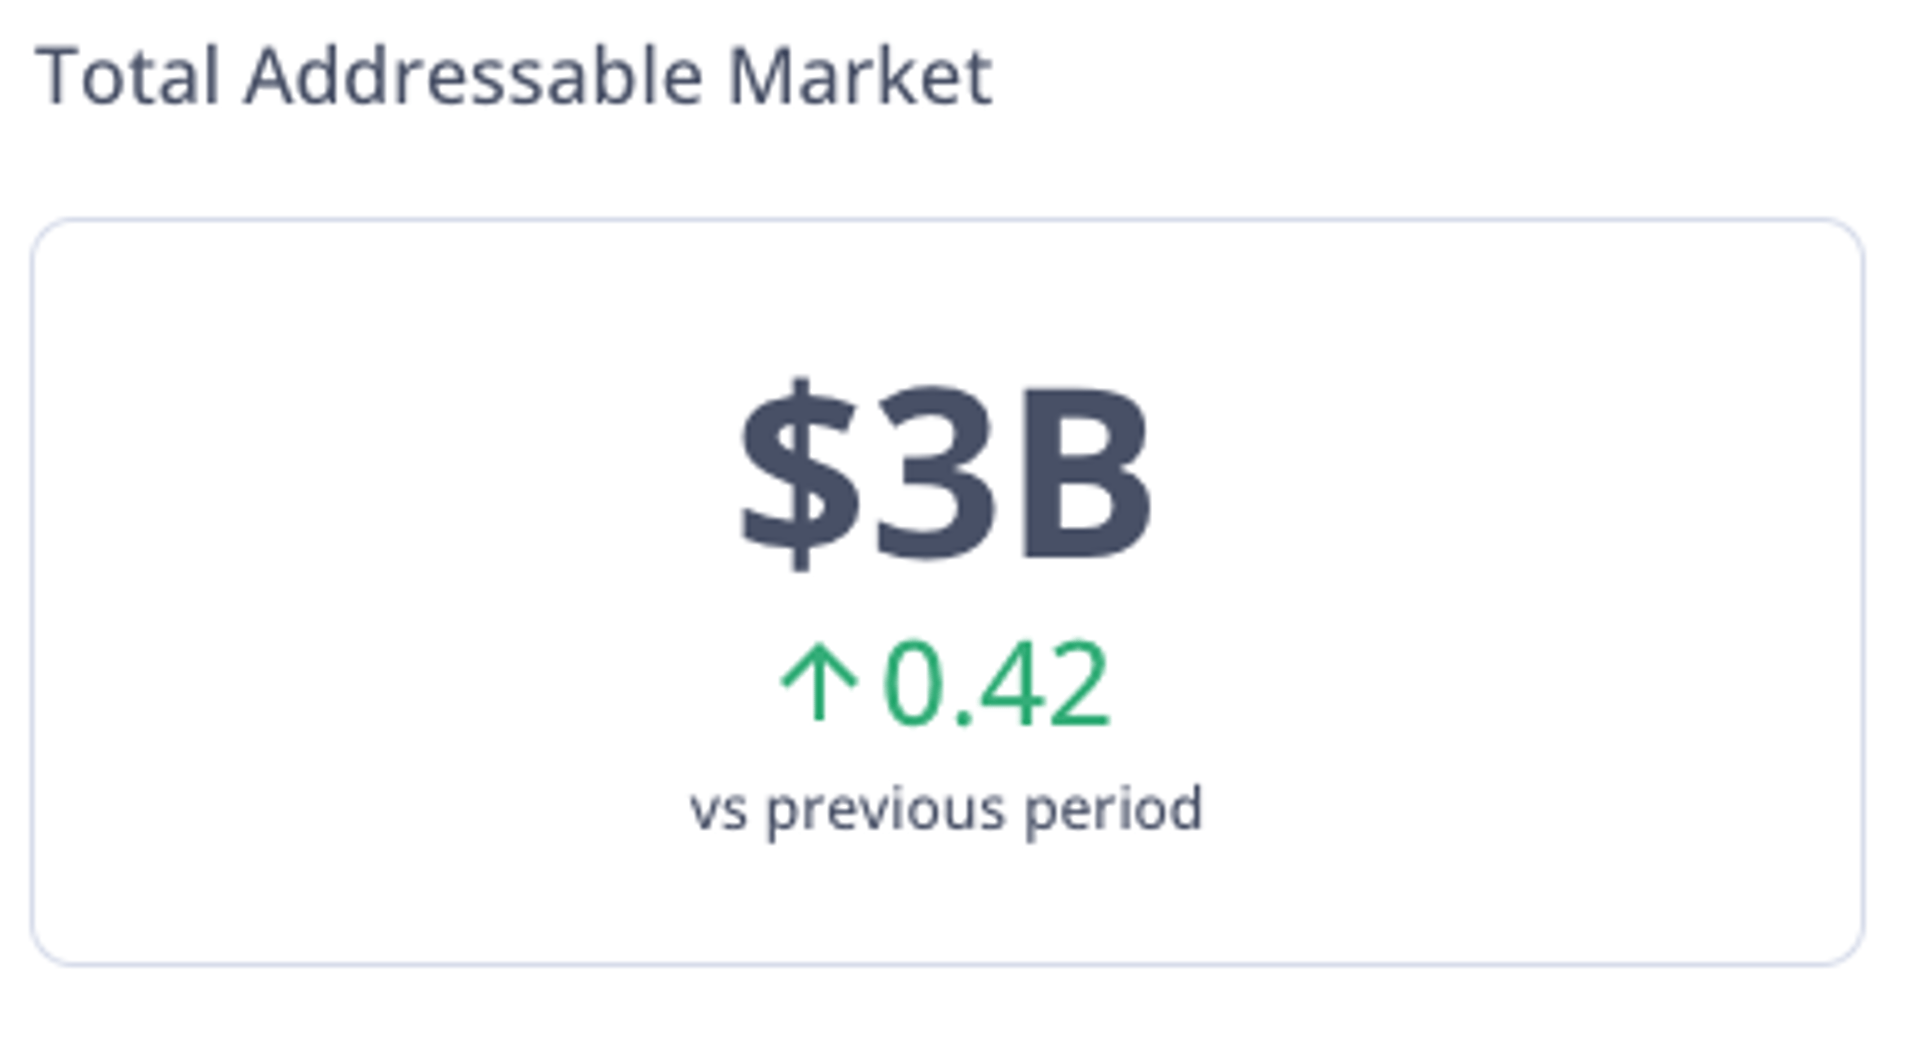
Total Addressable Market (TAM) estimates the full revenue opportunity for a product or service if you captured 100% of the market. TAM gives context to every other growth metric. Knowing how much runway exists shapes how aggressively to invest and what to tell investors about the ceiling.
Weighted ACV (WACV)
Expert contributor: Nnamdi Iregbulem
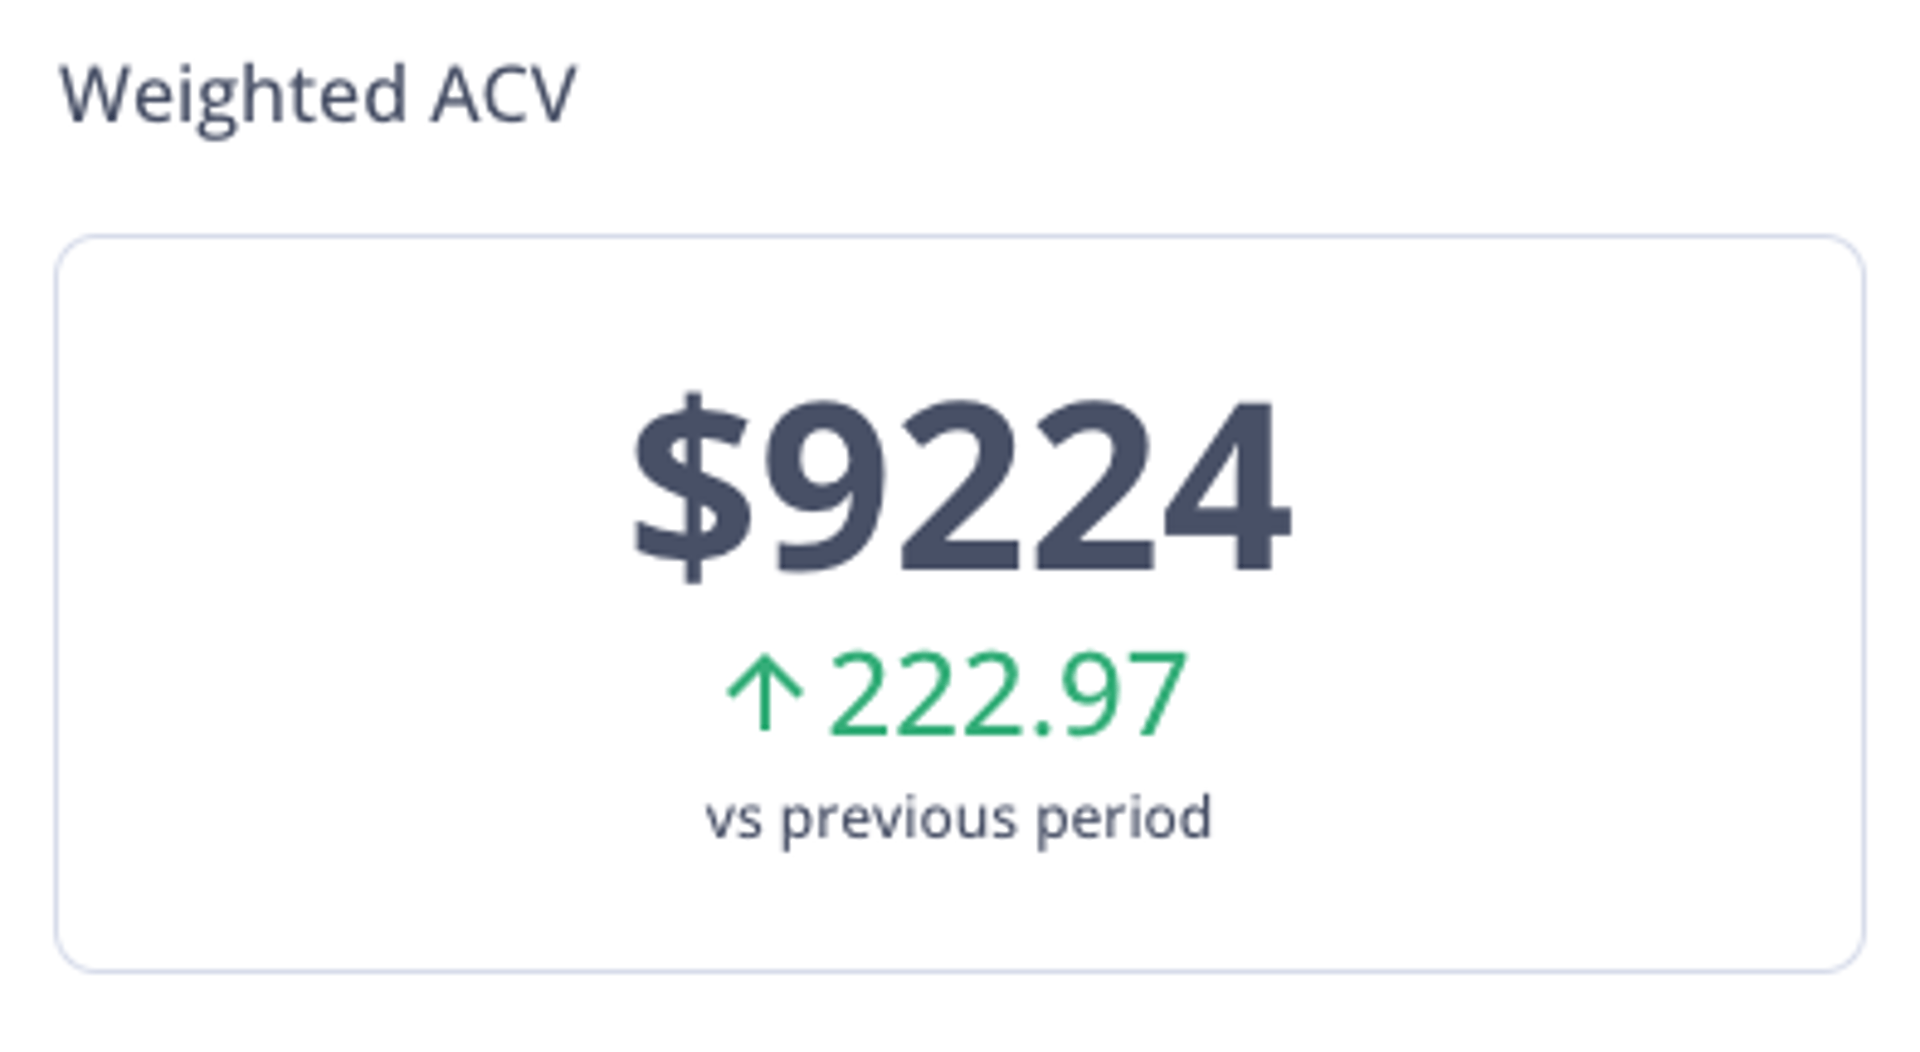
Weighted Annual Contract Value (WACV) calculates the average contract value using a weighted average proportional to each contract's size. It's useful when customer spend varies widely, giving you a more accurate picture of revenue concentration than a simple average would.
Reliable metrics start with clear definitions and consistent tracking. Explore MetricHQ for plain-English definitions and peer-reviewed context on every metric here. When your team is working from the same numbers, decisions get faster and investor conversations get easier.
Related Articles

Beyond simple sign-ups: how True Trials and Activation predict growth

5 tips to understand (and organize) your restaurant data
By Saleem Khatri — June 9th, 2026
6 dashboards I use daily to run my SaaS company
By Allan Wille, Co-Founder — April 10th, 2026